A Bad Looking Bitcoin Chart
John Barry | Thu May 21 2020
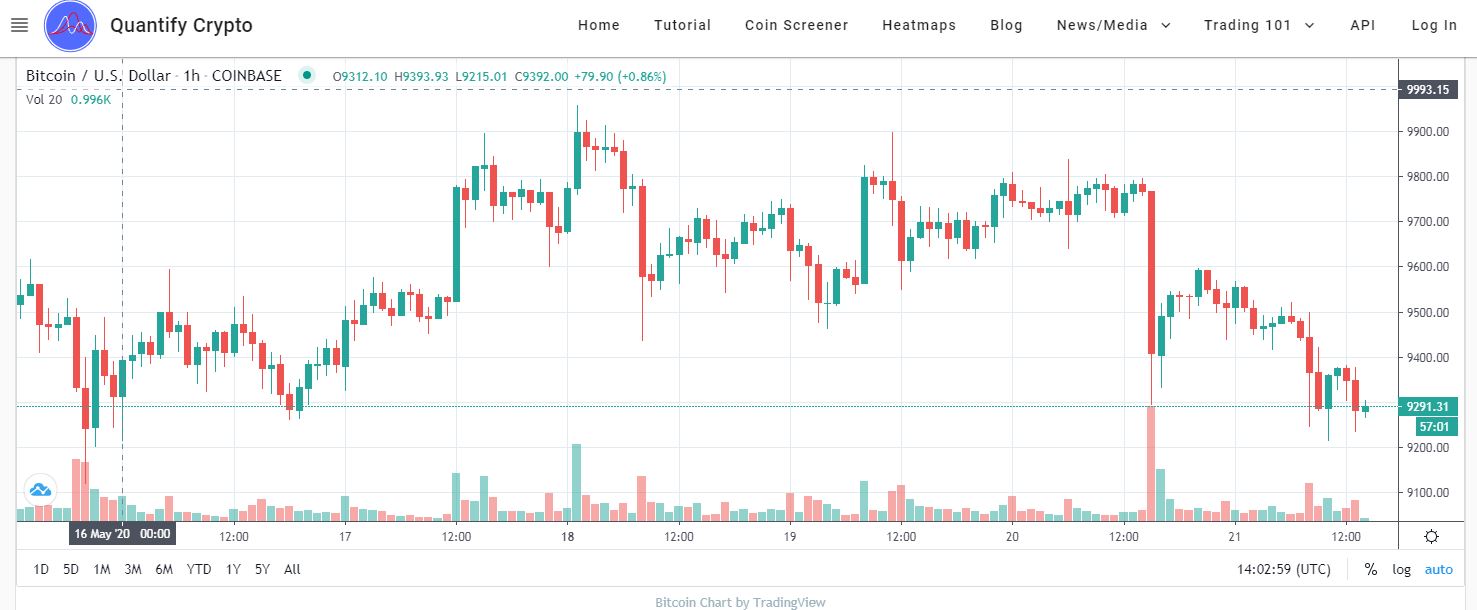
The 1 Hour Bitcoin chart looks terrible. It currently has a bear prepattern that can lead to a significant drop.
The Trend Mean score is bearish (14/100). The 1 hour MACD is Bearish, trading below is Baseline. It is trading below the $9,300 low price registered on most crypto exchanges yesterday. Support at this level seems weak.
A good time to take Bitcoin off the table. Be ready to buy the dip.
The platform Quantify Crypto provides live cryptocurrency prices, technical analysis, news, heatmaps and more. Our flagship product is the trend algorithm, designed to be on the correct side of significant cryptocurrency price moves.
We are a new site, please check us out and let us know what you like and do not like about the site. None of this is meant to be financial advice and I do not have any financial expertise. Although I worked at the New York Stock Exchange for over 23 years, it was as a developer supporting computer systems, not as a stock trader.
Full discloser: I do own Bitcoin and have stock positions.