The Advantage of Using Multiple Indicators in Crypto Trading
John Barry | Tue Jul 29 2025
In the volatile and fast-moving world of cryptocurrency trading, relying on a single technical indicator can lead to misleading signals and poor decision-making. Markets often react unpredictably to news events, liquidity shifts, and investor sentiment. To navigate this complexity, successful traders increasingly depend on a blend of multiple indicators and timeframes. By examining different technical signals such as MACD, RSI, Trend Scores, and Baselines across various time intervals, traders can develop a more well-rounded and accurate market perspective.
The key benefit of using multiple indicators is the ability to confirm or challenge the signals generated by one another. For instance, a bullish MACD crossover might initially look promising. But if that signal is not supported by RSI or trend momentum, it may turn out to be a short-lived move or even a false breakout. By contrast, when several indicators point in the same direction—especially across short-, medium-, and long-term timeframes—the probability of a sustained price movement increases significantly. This convergence can give traders the confidence to enter or exit a position with greater conviction.
A practical example helps illustrate this concept. Imagine a scenario where 3 out of 5 MACD indicators are bullish, all RSI readings are neutral, 4 out of 5 trend indicators are also neutral, and the Baseline indicator is bearish. In this case, although some signals lean bullish, others remain indecisive or even bearish. The overall interpretation of such mixed readings would be neutral. This highlights the importance of not relying on any single signal, but rather taking a weighted view across several tools to avoid premature conclusions.
Waiting for Most of the Indicators to Agree
Now consider a scenario where the indicators begin to align more clearly. One more MACD indicator flips bullish, two RSI timeframes shift to bullish, three trend indicators now show upward momentum, and the Baseline flips from bearish to bullish. This coordinated movement among indicators and across timeframes suggests a genuine shift in market sentiment. Such alignment often precedes strong price moves and can serve as an early confirmation of a bullish trend. It is during these moments of confluence that traders may find the most compelling opportunities.
Pudgy Penguins Example
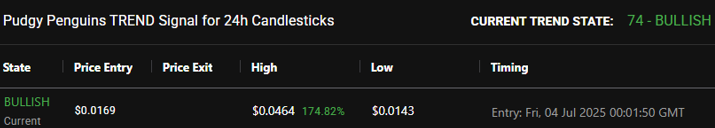
On July 4, the daily trend indicator—which analyzes daily candlesticks over a 200-day period—flipped from bearish to bullish for Pudgy Penguins. At the time, the token was trading at $0.0169, and most short-term indicators remained neutral. That quickly changed on July 9 and 10, when all trend indicators, three RSI timeframes, and five MACD indicators turned bullish. By July 10, Pudgy Penguins had risen to $0.0187, and by July 23, the price had surged to $0.047—representing a remarkable 175% gain in just three weeks.
Today, Pudgy Penguins is trading at $0.0381, and the momentum has shifted. Five different trend timeframes are now bearish. Among the RSI indicators, one is bullish while the remaining four are neutral. Meanwhile, five out of seven MACD indicators have turned bearish, suggesting that short- to mid-term sentiment has weakened significantly.
Ultimately, technical analysis is most effective when it is layered. Combining diverse indicators helps to smooth out market noise and minimizes the risk of acting on a false signal. While no system is foolproof, aligning multiple indicators can significantly improve trading accuracy. The Quantify Crypto platform excels at this by providing visual summaries of major indicators across multiple timeframes—empowering users to make informed decisions based on a holistic view of market dynamics.
Disclaimer
Quantify Crypto is an informational website that provides market data, technical analytics and links to news and commentary sources. Information published on Quantify Crypto platform should not be taken as investment advice in any way.
Quantify Crypto is not an investment adviser and you agree to not cite the Quantify Crypto platform or content as the reason or cause for making any trading decisions. Quantify Crypto is not accountable, directly, or indirectly, for any damage or loss incurred, alleged or otherwise, in connection to the use or reliance of any content you read on the site.
You agree not to consider the information on Quantify Crypto platform as a solicitation to invest in any cryptocurrencies, initial coin offerings, or other financial instruments.
Past performance of any signals, strategies, or market data presented on the Quantify Crypto platform is not indicative of future results and does not guarantee future returns.