The next move for Bitcoin
John Barry | Tue May 05 2020
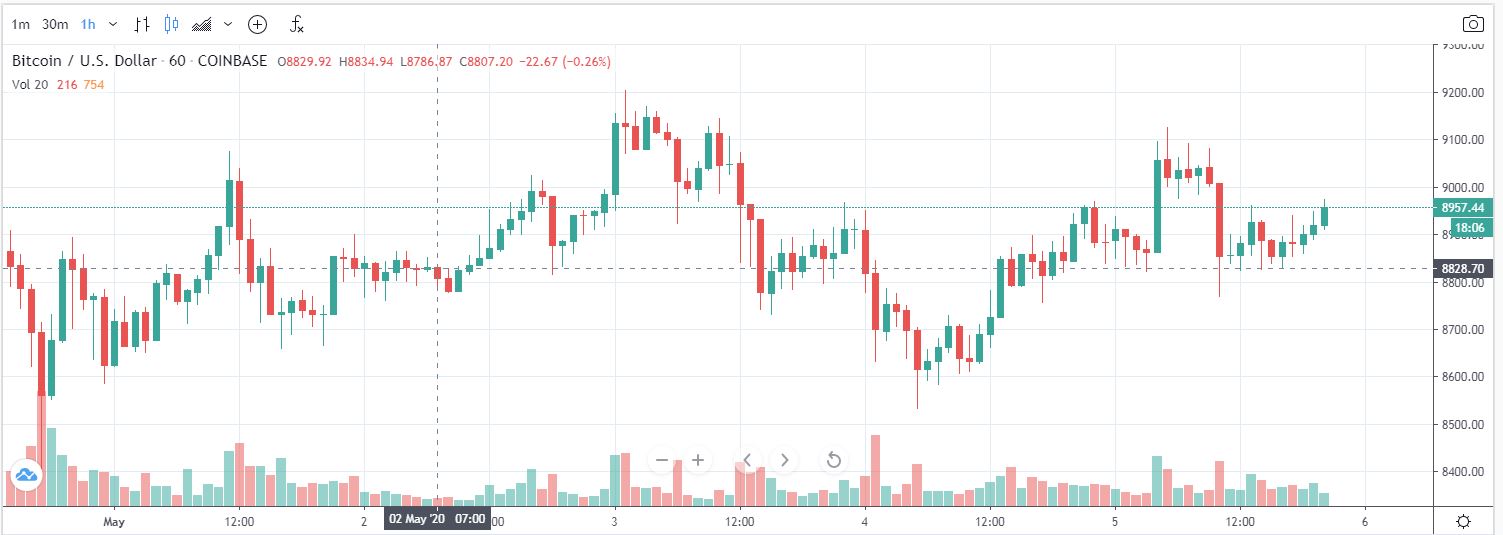
Bitcoin has been on an impressive run since March 12th when it hits lows just below the $4,000 and continued a steady price increase until April 28th when it was trading at $7,800. At which point I felt Bitcoin chart was looking very positive and I wrote about it. Our trend algorithm on the website was positive due to the slowly increasing 1-hour candle pattern.
https://quantifybtc.com/blog/a-good-looking-bitcoin-chart
On April 30th Bitcoin completed its upward price spike to $9,450 (+17% in one day). After that sharp increase, I did take profits and completely sold out of my position. Normally after a major price swing, it is good to let an asset re-establish a price pattern. After the price spike Bitcoin had a very predictable decrease back down to the $8,400 level.

On May 2nd, I put 50% back in at the $9,000 level although our indicators were mostly neutral (trend mean was 63). Since April 30th it had not retested the $8,400 level and has hit a high price of $9,200. The bullish trading pattern started to form on morning of May 4th (EST) increasing to a price of $9,125 however this level did not have staying power and the price fell back to $8,700.
As I mentioned in earlier articles I do like seeing a steady upward price pattern for 12 – 48 hours before buying back in. If the May 5th low price of $8,766 continues to be the low price for the next 24 hours I will buy more. Currently the Quantify Crypto trend mean indicator is a bullish 86/100 (May 5th – 16:30 EST).
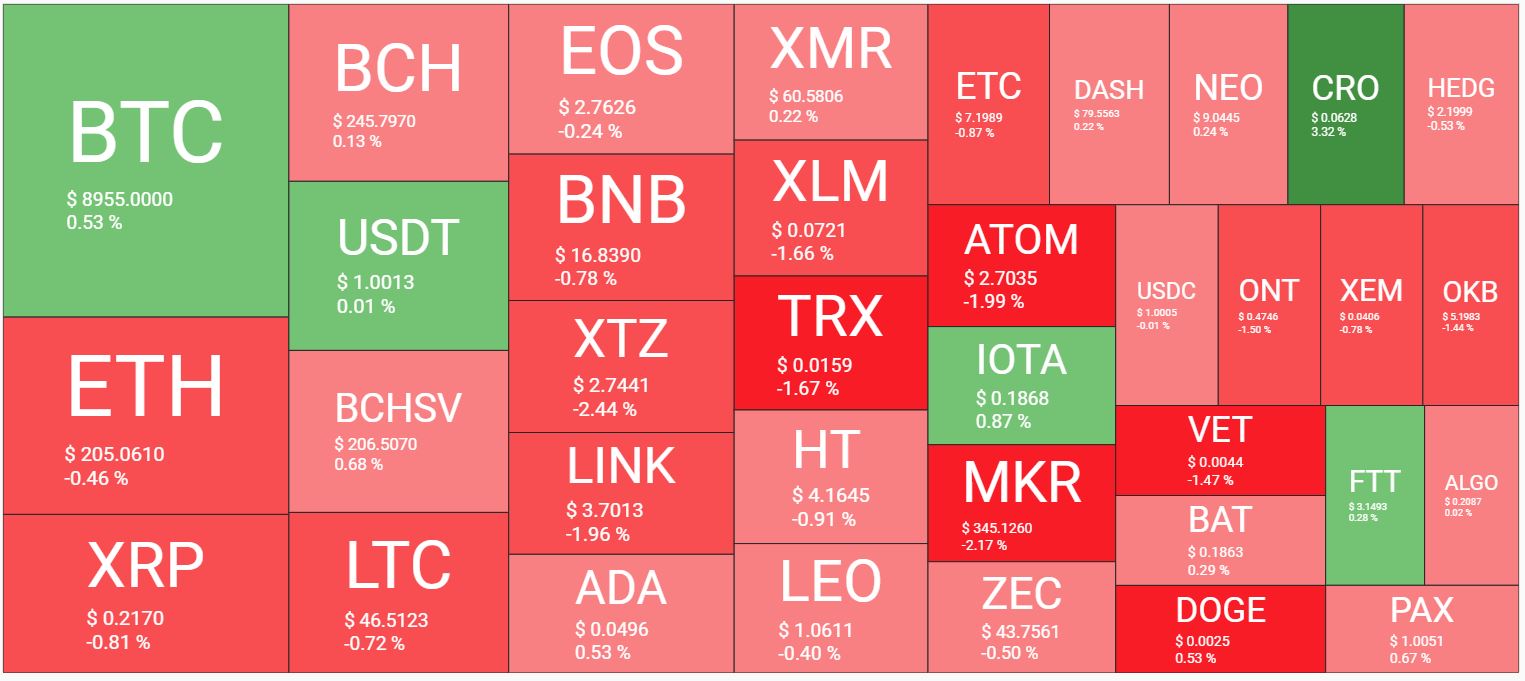
Overall, the top cryptocurrencies have been moving the same as Bitcoin, although most did not increase much as Bitcoin on April 29th.

In the heatmap you can see most cryptos are within 2% of Bitcoin’s performance in the past 24 hours. In summary, I am mildly bullish on Bitcoin at this level, Bitcoin appears to be leading while the other cryptocurrencies are following. My plan is to buy more if current price levels hold for the next 24 hours.
The platform https://quantifycrypto.net/ provides live cryptocurrency prices, technical analysis, news, heatmaps, and more. Our flagship product is the trend algorithm, designed to be on the correct side of significant cryptocurrency price moves. We are a new site, please check us out and let us know what you like and do not like about the site.
The most important technical tool is the Price Chart. Our site guides you to identify the "Hot" cryptocurrency that you should be viewing now. Just click on a heatmap tile or coin name to view its price chart.
None of this is meant to be financial advice and I do not have any financial expertise. Although I worked at the New York Stock Exchange for over 23 years, it was as a developer supporting computer systems, not as a stock trader.
Full discloser: I do own Bitcoin and have stock positions.