Bitcoin Bull Run - Up 867% with Thirteen 20% Dips Since Jan 1, 2019.
Lisa Coppola | Tue Jun 29 2021
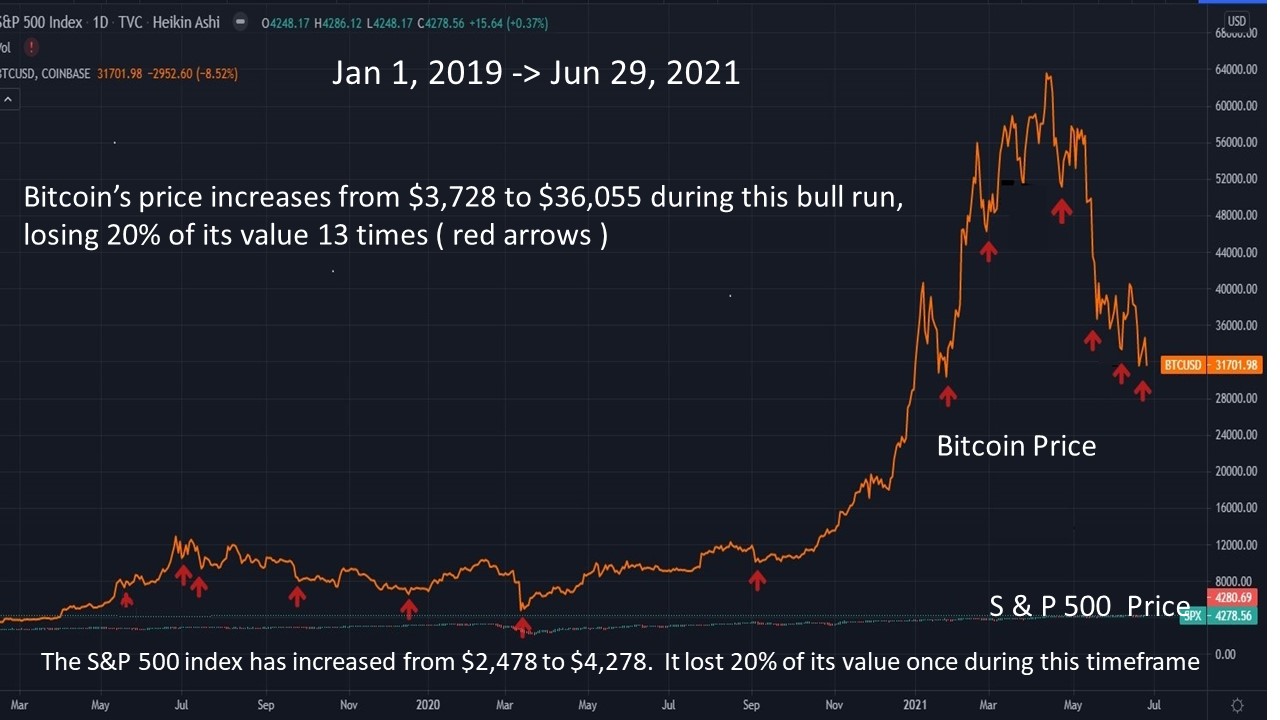
The stock market and other financial asset markets are more established and mature compared to the cryptocurrency market, therefore traditional markets experience more moderate price moves. For example, since January 1st, 2019, Bitcoin has lost 20% of its value 13 times whereas the S&P 500 index has only lost 20% of its value once. These movements are illustrated on the chart below. See Appendix A at the end of this article for additional details.
Clearly, the crypto market is much more volatile than the stock market. This is no surprise considering Bitcoin was only created 12 years ago. Crypto price pattern analysis is still fairly new. Technical analysis tools that were developed decades ago to monitor much smaller price movements are inadequate when it comes to cryptocurrency.
At Quantify Crypto, we have found that short term price trends are much more important in the crypto market than in the stock market. Flat or minor price movements that occur within a 12-48 hour time period often lead to significant price movements in that same direction over time. This concept is referred to as “setup to signal”.
Long-term moving averages of 50 and 200 days that traditionally work well for the stock market will lag significantly due to crypto’s volatility. This makes entry and exit points unclear. Our trend algorithm uses the “setup to signal” to determine trend score.
Demonstrated below are examples of when our trend algorithm accurately predicted a bearish and bullish position for Bitcoin using these technical analysis tools.
Bitcoin from March 6th - March 15th in 2020
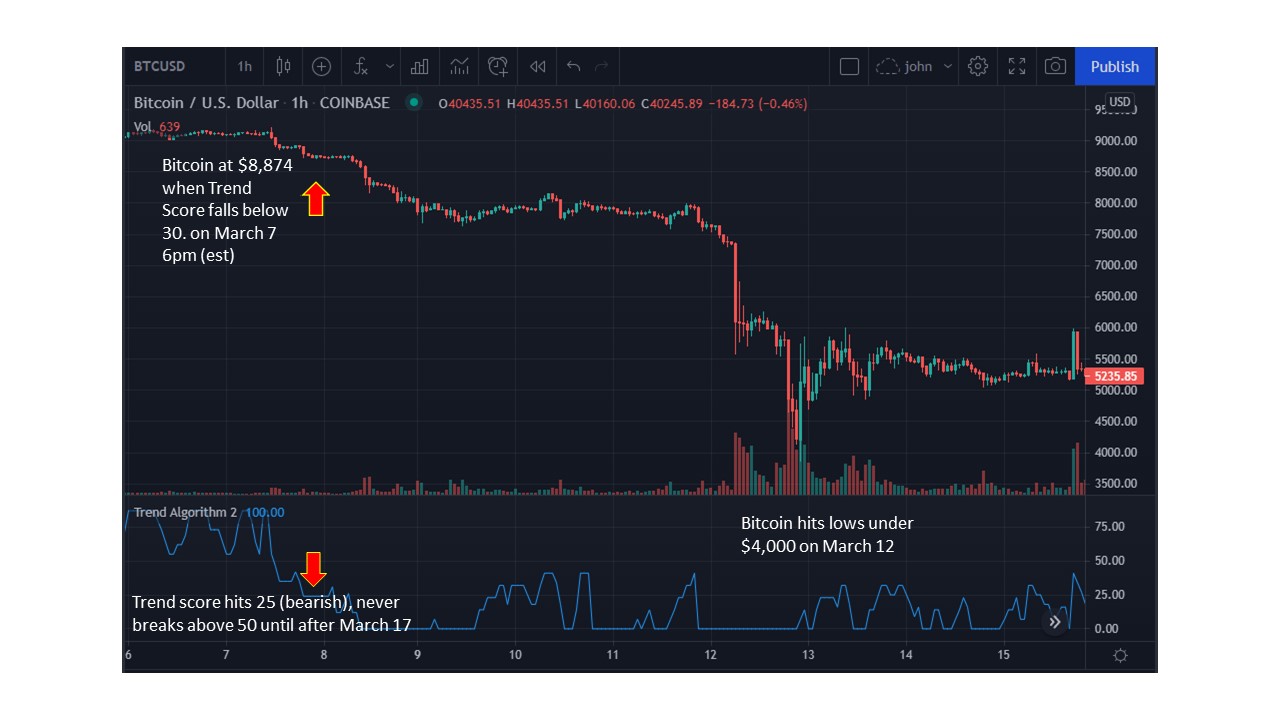
On March 7th in 2020 Bitcoin dropped from $9,198 to $8,874. The arrows indicate where the slight price movement occurred for 24 hours. This is when our trend score for Bitcoin fell below 30, predicting a bearish trend. Bitcoin continued to trend downwards over time. There was a small attempt for Bitcoin to rise on March 10th and 12th, but since these price movements only occurred for less than 12 hours, they were not significant enough to change the trend. We saw this when Bitcoin dropped below $4,000 on March 12th.
Bitcoin from October 16th - 27th in 2020

On October 17th, a slow price increase to $11,386 indicated a bullish trend for Bitcoin. The arrow shows where this setup to signal occurred. Bitcoin gradually increased in value over the next few days. There were some attempts to go down, but they never lasted more than 12 hours therefore, Bitcoin continued to trend upwards. Bitcoin went all the way up to $13,789 on October 27th.
The following link can be used to reference additonal examples of the Quantify Crypto Trend Algorithm https://quantifycrypto.s3-us-west-2.amazonaws.com/pdf/Quantify+Crypto+Trend+Indicator+Synopsis+May+2020.pdf
Tracking cryptocurrency markets with notorious price volatility can be a daunting task. The tools on our site can help you navigate spikes and dumps, capture major wins, and avoid severe losses. The Quantify Crypto platform puts technical analysis information at the fingertips of crypto traders and investors that seek opportunity in the digital asset market.
The goal of our algorithm is to point traders in the right direction, putting them on the correct side of a trade when significant price changes occur in the crypto market.
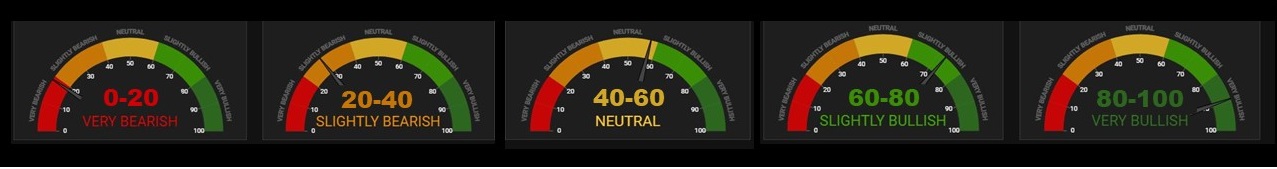
Quantify Crypto Trend Scores (displayed on quantifycrypto.com)
Key Points
- Crypto market price patterns are significantly different from the stock market.
- After extensive research and our own personal trading experiences with cryptocurrency, we developed the Quantify Crypto Trend Score, a trend algorithm specifically for cryptocurrency price patterns.
- Cryptocurrency is much more volatile than the stock market, therefore it should be looked at through a different technical analysis lens.
- Our Trend Score can put you on the right side of a trade and help determine entry and exit points.
- Short term price movements are critically important in crypto.
- Small price moves that occur within a 12–48-hour time frame (setup to signal) often lead to significant price moves in that same direction over time.
- Our Trend Score is an accurate momentum indicator. It has reliably and accurately predicted cryptocurrency price trends in the past.
Appendix A - Bitcoin Price Dips greater than 20% - Jan 1, 2019 thru June 30, 2021
| 1 | Price Peak | Signal Price | Future Price | Peak to Signal | Signal to Low Price | Dip Percentage |
| 5/15/2019 | * | 5/16/2019 | ||||
| 8,391 | 6,593 | 6,593 | -21.4% | 0.0% | -21.43% | |
| 2 | Price Peak | Signal Price | Future Price | Peak to Signal | Signal to Low Price | Dip Percentage |
| 6/26/2019 | 6/30/2019 | 7/2/2019 | ||||
| 13,849 | 11,227 | 9,657 | -18.9% | -14.0% | -30.27% | |
| 3 | Price Peak | Signal Price | Future Price | Peak to Signal | Signal to Low Price | Dip Percentage |
| 8/6/2019 | 8/10/2019 | 8/15/2019 | ||||
| 12,310 | 11,330 | 9,459 | -8.0% | -16.5% | -23.16% | |
| 4 | Price Peak | Signal Price | Future Price | Peak to Signal | Signal to Low Price | Dip Percentage |
| 9/6/2019 | 9/16/2019 | 9/26/2019 | ||||
| 10,938 | 10,116 | 7,738 | -7.5% | -23.5% | -29.26% | |
| 5 | Price Peak | Signal Price | Future Price | Start to Signal | Signal to Low Price | Dip Percentage |
| 10/25/2019 | 11/7/2019 | 11/25/2019 | ||||
| 10,527 | 9,178 | 6,522 | -12.8% | -28.9% | -38.05% | |
| 6 | Price Peak | Signal Price | Future Price | Peak to Signal | Signal to Low Price | Dip Percentage |
| 2/13/2020 | 3/7/2020 | 3/12/2020 | ||||
| 10,521 | 8,877 | 3,853 | -15.6% | -56.6% | -63.38% | |
| 7 | Price Peak | Signal Price | Future Price | Peak to Signal | Signal to Low Price | Dip Percentage |
| 8/17/2020 | 9/16/2019 | 9/5/2020 | ||||
| 12,492 | 11,333 | 9,811 | -9.3% | -13.4% | -21.46% | |
| 8 | Price Peak | Signal Price | Future Price | Peak to Signal | Signal to Low Price | Dip Percentage |
| 1/8/2021 | 9/16/2019 | 1/21/2021 | ||||
| 41,778 | 35,140 | 28,669 | -15.9% | -18.4% | -31.38% | |
| 9 | Price Peak | Signal Price | Future Price | Peak to Signal | Signal to Low Price | Dip Percentage |
| 2/14/2021 | 2/23/2021 | 2/28/2021 | ||||
| 58,434 | 48,736 | 42,992 | -16.6% | -11.8% | -26.43% | |
| 10 | Price Peak | Signal Price | Future Price | Peak to Signal | Signal to Low Price | Dip Percentage |
| 4/14/2021 | 4/17/2021 | 4/25/2021 | ||||
| 64,843 | 60,109 | 47,024 | -7.3% | -21.8% | -27.48% | |
| 11 | Price Peak | Signal Price | Future Price | Start to Signal | Signal to Low Price | Dip Percentage |
| 5/10/2021 | 5/11/2021 | 5/23/2021 | ||||
| 59,499 | 54,775 | 30,900 | -7.9% | -43.6% | -48.07% | |
| 12 | Price Peak | Signal Price | Future Price | Peak to Signal | Signal to Low Price | Dip Percentage |
| 5/26/2021 | 6/4/2021 | 6/8/2021 | ||||
| 40,819 | 36,286 | 30,979 | -11.1% | -14.6% | -24.11% | |
| 13 | Price Peak | Signal Price | Future Price | Peak to Signal | Signal to Low Price | Dip Percentage |
| 6/15/2021 | 6/18/2021 | 6/22/2021 | ||||
| 41,282 | 37,677 | 28,895 | -8.7% | -23.3% | -30.01% |
The platform Quantify Crypto provides live cryptocurrency prices, technical analysis, news, heatmaps and more. Our flagship product is the trend algorithm, designed to be on the correct side of significant cryptocurrency price moves.
None of this is meant to be financial advice and I do not have any financial expertise.