Bitcoin Halving - History and Future Price Analysis
John Barry | Fri Feb 02 2024
Bitcoin, the world's first and most well-known cryptocurrency, undergoes a significant event approximately every four years known as the "Bitcoin Halving." During past halvings, Bitcoin has experienced some of its most significant gains. This article delves into the historical price movements of Bitcoin and offers insights into how the upcoming Bitcoin Halving is shaping up i
In comparison to previous Halvings.
Key Bitcoin Halving Points covered in this analysis:
- Comparing today’s price, 80 days before the Bitcoin Halving, shows a similar price increase (55%) has occurred up to this point as in 2016 (64%) and 2020 (34%) before those Bitcoin Halvings.
- The largest price movements in 2016 and 2020 began 3 to 4 months after the Bitcoin Halving.
- Due to the much larger market cap, liquidity, and trading volume today, it will be challenging to achieve similar exorbitant gains on a percentage basis. However, price history does show that a significant gain may occur.
- The next Bitcoin price peak projection is reviewed at the end of this document.
What is Bitcoin Halving?
Bitcoin Halving is a process embedded in Bitcoin's protocol that reduces the reward for mining new blocks by half, thereby slowing down the rate at which new Bitcoins are created. This event occurs every 210,000 blocks, roughly every four years, and is significant because it affects the supply of new Bitcoins.
Systematically reducing the rate at which new coins are generated creates a deflationary effect as the supply growth of Bitcoin slows down. In contrast, central bank policies often involve increasing the money supply, either through lowering interest rates or quantitative easing, which can lead to inflation by devaluing the existing currency. This may be the most fundamental reason why investors buy Bitcoin.
Analysis Below uses the “80 Day Before” for some price analysis as Feb 2, 2024, is 80 days before the next Bitcoin Halving on April 22.
Analysis of the 2016 Bitcoin Halving
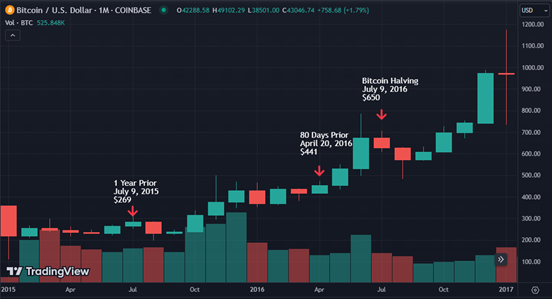
2016 Halving Prices: 1 Year Prior: $269; 80 Days Prior: $441; Halving Day: $650; Yearly gain prior 142%; Peak Gain after 360%; 1 Year Prior to 80 days prior: 64%.
The 2016 Bitcoin halving marked a significant upward trend in its price. One year prior to the halving, Bitcoin's price stood at $269. It then rose to $441, 80 days before the event, marking a 64% increase. Following the halving, the upward trend continued, with the price reaching $763 two months later, and eventually hitting a peak of $2,988 in the following year. This period from the halving to its peak represented a remarkable 360% increase in value.
Analysis of the 2020 Bitcoin Halving
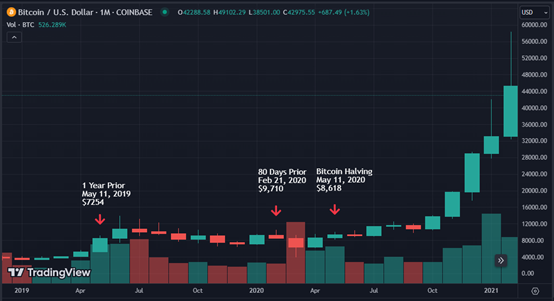
2020 Halving Prices: 1 Year Prior: $7,254; 80 Days Prior: $9,710; Halving Day: $8,618; Yearly gain prior 19%; Peak Gain after 699%; 1 Year Prior to 80 days prior: 32%.
The 2020 halving presented a more complex picture. One year prior, Bitcoin was valued at $7,254 and increased to $9,710 80 days before the halving. However, there was a slight drop 80 days before the halving to the halving day to $8,618, followed by a modest recovery to $9,320 two months later. The significant jump occurred later in the year when the price skyrocketed to $68,871, marking a 699% increase from the post-halving price. There is an important factor that is not included in the numbers above. What was impacting the Bitcoin price in February and March of 2020?
Covid 19 Impact on 2020 Bitcoin Halving
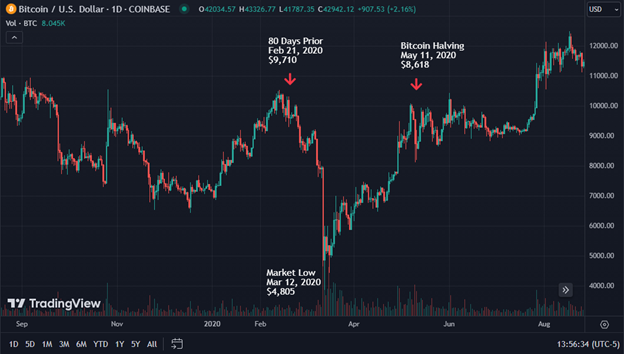
The answer is that COVID was happening. Most countries were going into lockdown at some point in January 2020. Many assets were experiencing panic selling, starting with the stock and bond markets and extending to the highly volatile Crypto markets. Bitcoin reached a mini peak of $9,710 on February 21st and proceeded to lose half its value in less than three weeks during a global selling event. On March 12th, there was a liquidity crunch; some crypto exchanges went down, leading to margin losses of a significant crypto fund, causing them to go bankrupt. Bitcoin, being the volatile asset it is, recovered most of its price decline over the next two months, before achieving spectacular gains later that year.
Today’s Price Chart – 80 Days until the Bitcoin Halving
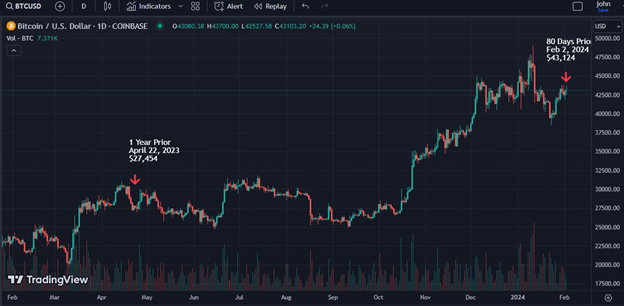
1 Year Prior: $27,454; 80 Days Prior: $43,124; 1 Year Prior to 80 days prior: 54%.
Comparing the price move today to 2016 and 2020 Bitcoin historic price shows a very similar price increase to both of those time frames. In 2016 the price increase from 1 year prior to 80 days prior was 64%, in 2020 it was 34% and today it is 55%. Comparing 2016 price movement to 2020 price movement showed 2016 outperformed 2020 prior to the halving while 2020 outperformed 2016 after the halving. The most important point is the significant price surge that occurs, not immediately, but a few months after each halving.
Historically, the halving events have led to significant increases in Bitcoin's price over the following months and years. While past performance is not indicative of future results, this pattern suggests that the reduced supply inflation rate positively affects market sentiment and prices.
If the Bitcoin Halving Price Performance repeats what occurred in 2016 and 2020
Applying the data points in this article to a simple linear projection yields a Bitcoin price of $174,215 peak price after the halving.
2016 Halving Average Gain: (142% + 360%) / 2 = 251%
2020 Halving Average Gain: (19% + 699%) / 2 = 359%
Average Gain: (251% + 359%) / 2 = 305%
Current Bitcoin Price (Jan 30, 2024): $43,000
Linear Projection: $43,000 * (1 + 305%) = $174,215
Disclaimer
Quantify Crypto is an informational website that provides research reports, market data, technical analytics and links to news and commentary sources. Information published on Quantify Crypto platform should not be taken as investment advice in any way. Quantify Crypto is not an investment adviser and you agree not to site the Quantify Crypto platform or content as the reason or cause for making any trading decisions. Quantify Crypto is not accountable, directly or indirectly, for any damage or loss incurred, alleged or otherwise, in connection to the use or reliance of any content you read on the site. You agree not to consider the information on Quantify Crypto platform as a solicitation to invest in any cryptocurrencies, initial coin offerings, or other financial instruments.