Bitcoin Ready to go SuperNova
John Barry | Sat Apr 04 2020
Bitcoin is testing the $7,000 price resistance level for the 6th time in the past two weeks. The April 2nd test saw the Bitcoin price reach $7,295, yet only spent about one hour above $7,000.
Support was found at the $6,700 level two hours later and continues to hover above this support level. The price pattern currently for Bitcoin matches several price patterns that have occurred in the past year before major Bitcoin price spikes.
The Trend Algorithm on the QuantifyCrypto.net website is designed to catch this trading pattern and is currently giving a trend mean score of 100 out of 100. Specifically, the key strategies for our algorithm are:
- Cryptocurrency price movements have significant spikes and dumps. The primary objective is to capture major wins and avoid severe losses. Being on the correct side for significant price moves is more important than the percentage of winning trades.
- Shorter-term time periods are equally significant as longer-term time periods. Often the best buy and sell short opportunities are when all time periods agree with the price directional.
- Most significant price spikes are preceded by slower, smaller and steady price movements in the same direction. This has occurred at least 12 times in the past year!
Most of the charts used in this analysis are 1-hour charts, except where noted. You can jump ahead to the end at any time to review the current market conditions (for April 4th, 2020). This analysis highlights some of these 12 price patterns; look for a future document that will contain all 12 bullish examples and some bearish examples.
Scenario: March 25 - April 3, 2019
Starting Price: $3,881 Trend Entry Price $4,019 Price Peak $5,470 Price Gain 36%
Trend Entry Price - When our Trend Algorithm signals to enter into a long position.
Percentage gain is from Signal Price to Price Peak
Price Setup Chart
The "before" chart shows the Bitcoin price from March 26th to April 1st, 2019. Of note is the 3.5% price increase, which the Trend Algorithm detects as a bullish price movement, a perfect score of 100 out of 100. This may look like a significant price movement; however, this is just the setup.
After Chart - Results
This chart is from March 31st to April 3rd (2019). See how insignificant the price increase from March 31st to April 1st appears now. Note the exploding upward price spike of 36%. This is an excellent example of a slight price increase followed by a large jump. There have been at least 15 price patterns like this in the past year.
I am not going to detail all 12 case studies I have in this article. I will be producing an expanded version this will cover all 12 in the next week, check the website for this. However, I will show a few more examples and the current setup.
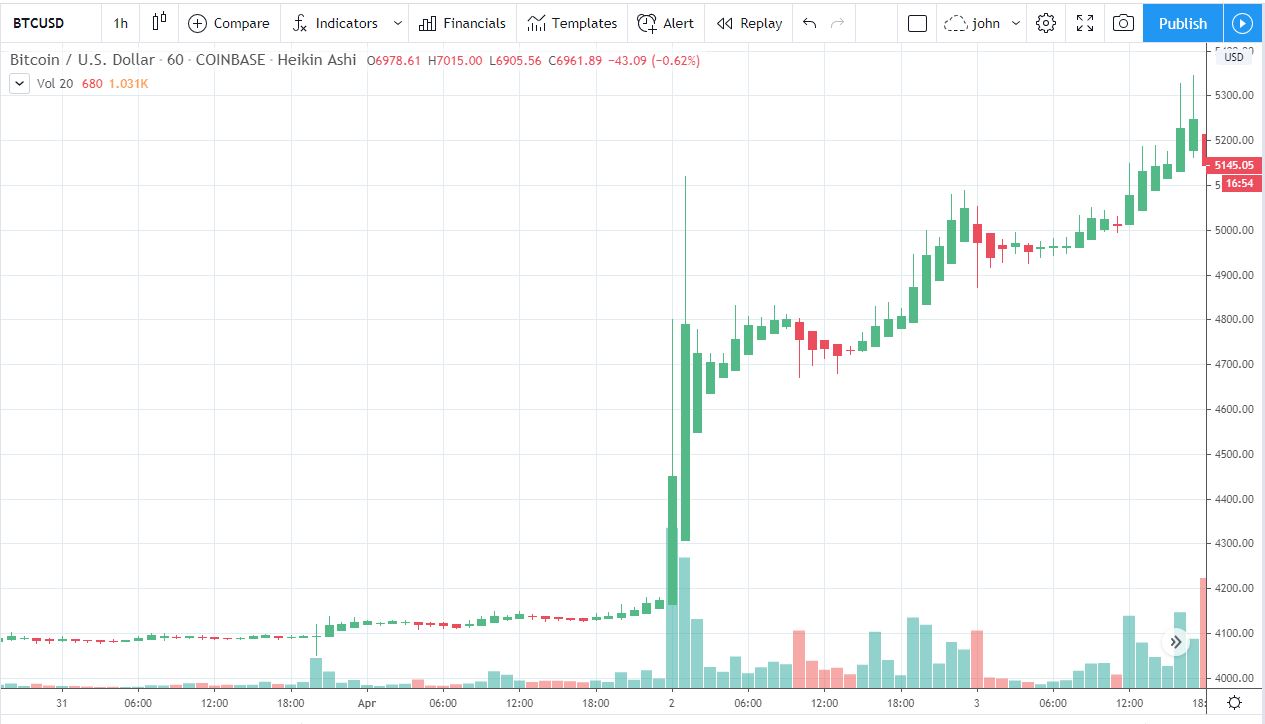
Scenario: April 29 - May 15, 2019
Starting Price: $5,145 Trend Entry Price $5,311 Price Peak $8,381 Price Gain 58%
Before Chart – Setup
Again the 1-hour candles show the steady increase that translates to a high score by our trend algorithm. The TradingView chart shows the Bitcoin price movement from the night of April 28th, 2019 to the morning of May 2nd.
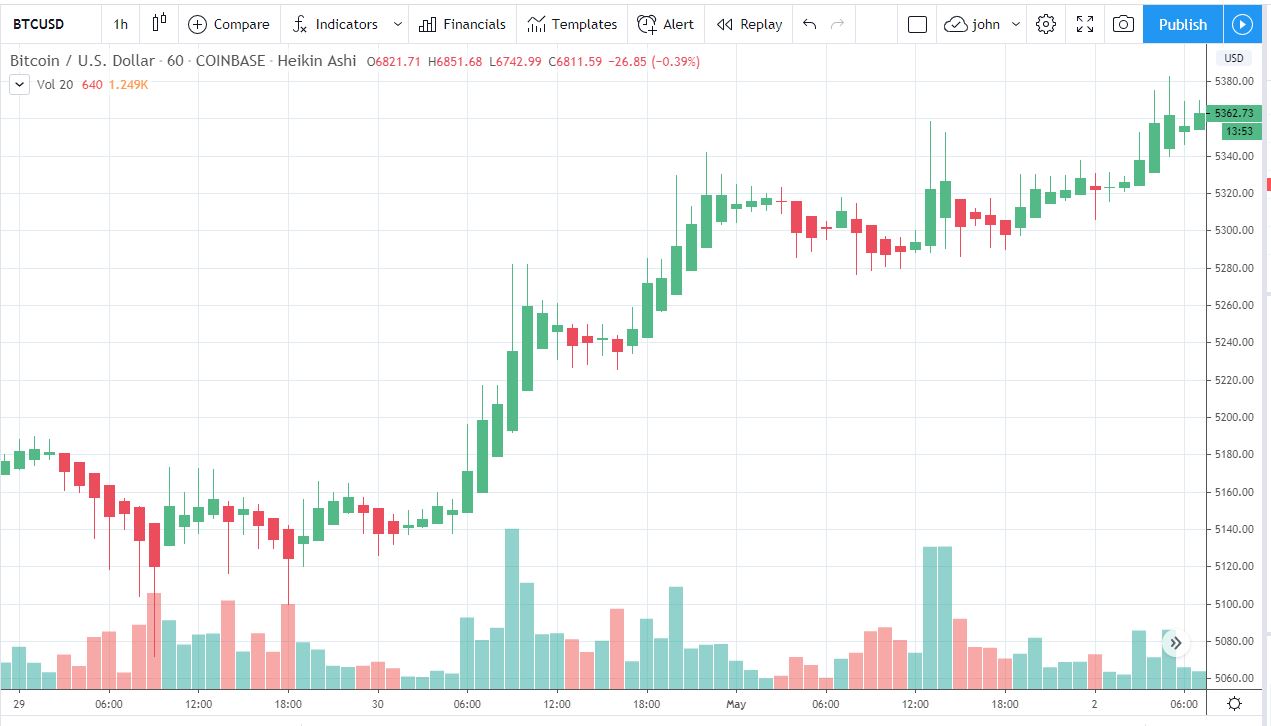
After Chart - Result
I feel the 1-hour candlesticks are critically important when looking at Bitcoin's price performance. Are you convinced yet? This was a 58% gain. An almost identical setup occurs less than 1 month later.
Scenario: June 6 - 26, 2019
Starting Price: $7,802 Trend Entry Price $8,115 Price Peak $13,841 Price Gain 70%
Before Chart – Setup
An important note about this setup chart, the Algo entry point is on June 13 at 9:00, represented as one of the last 1-hour candlesticks displayed.
After Chart – Result
This chart has 4-hour candlesticks to capture the 23-day duration of this uptrend. This was the biggest upward price move in 2019 for Bitcoin.

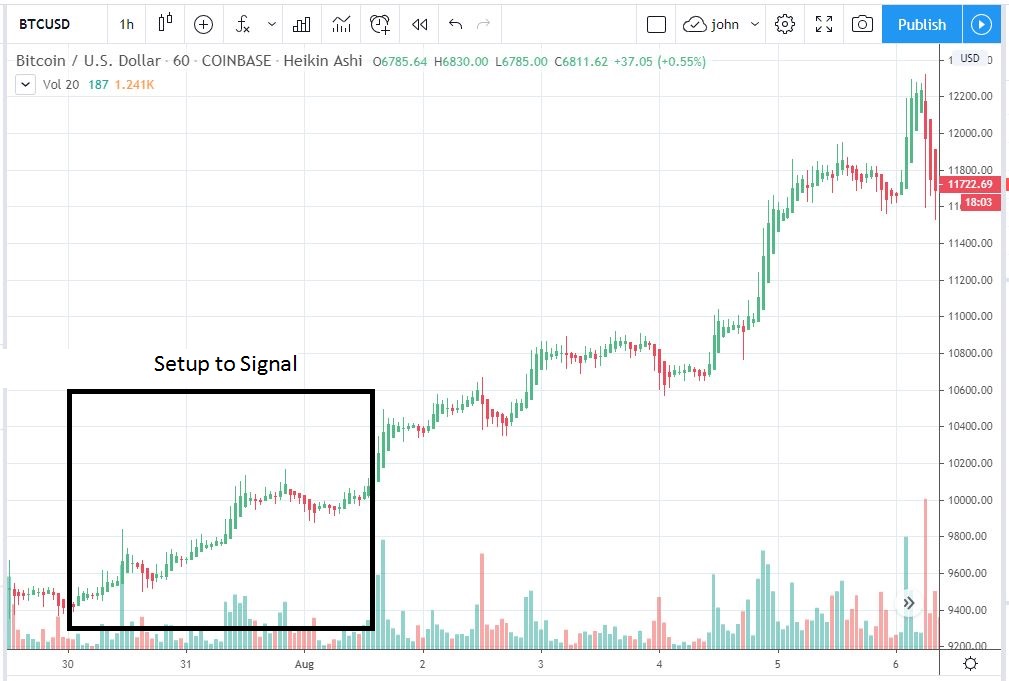
Scenario: July 30 - August 6, 2019
Starting Price: $9,377 Trend Entry Price $10,075 Price Peak $12,305 Price Gain 22%
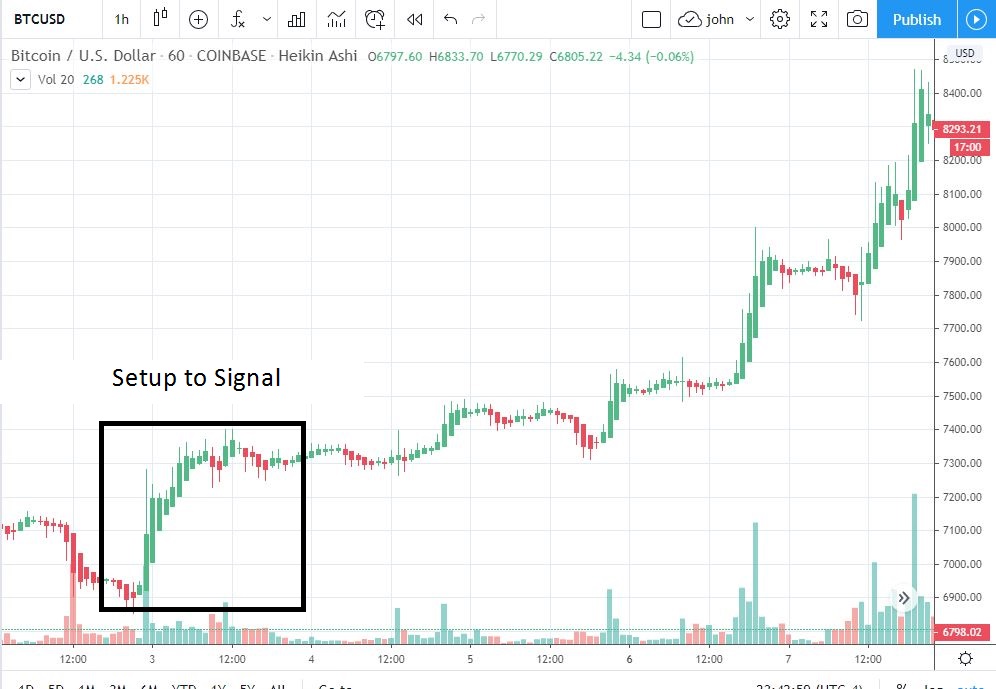
Scenario: The Bitcoin Death Cross Hoax
Starting Price: $7,420 Trend Entry Price $7,677 Price Peak $12,305 Price Gain 37% (1 day gain)
I wrote an article about the Bitcoin Death Cross trading day, 36.8% gain for one day!
https://www.uptrennd.com/post-detail/the-bitcoin-death-hoax-of-2019~MTgzNzc3
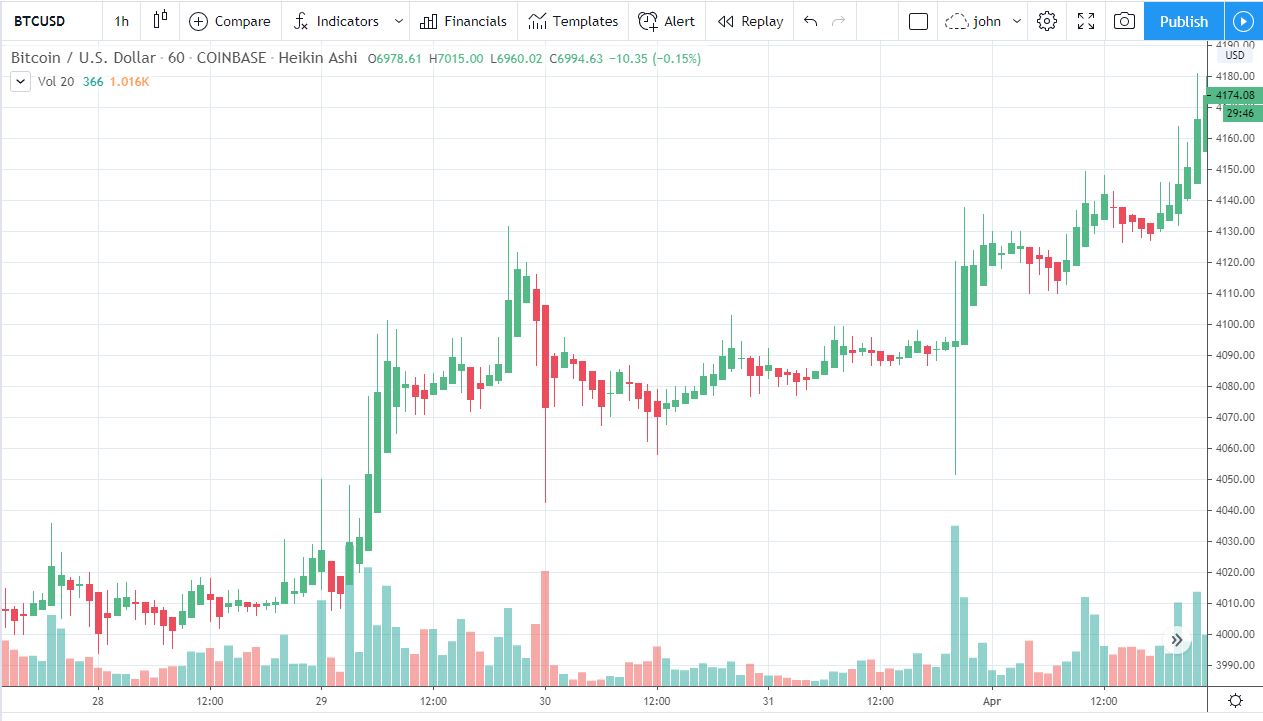
Scenario: Jan 2 - Jan 7, 2020
Starting Price: $6,905 Trend Entry Price $7,330 Price Peak $8,475 Price Gain 15.6%
Similar charts and conditions also occur Jan 10th - 18th and Feb 4th - Feb 9th.
Summary:
- Our Trend Algorithm is best at detecting "entry" conditions for potential Bitcoin price increases.
- One hour candlestick charts are critically important
- You need to be using a good momentum indicator. I recommend our trend algorithm that is free on our coin screener page. https://quantifycrypto.net/coin-screener
- Slow, steady Bitcoin price increases often lead to major Bitcoin price increases.
- Sometimes slow, steady increases lead only to flat or minor downward trends, rather than to severe downtrends.
- FOMO occurs after gains of 10% to 15%. Do not be afraid to enter when gains are still less than 10% in the short to medium term.
- While the examples I cite are within the past year, the research our team performed was based on 2016 through 2018 Bitcoin price movements. The prototype of our Trend Algorithm started running in May of 2019.
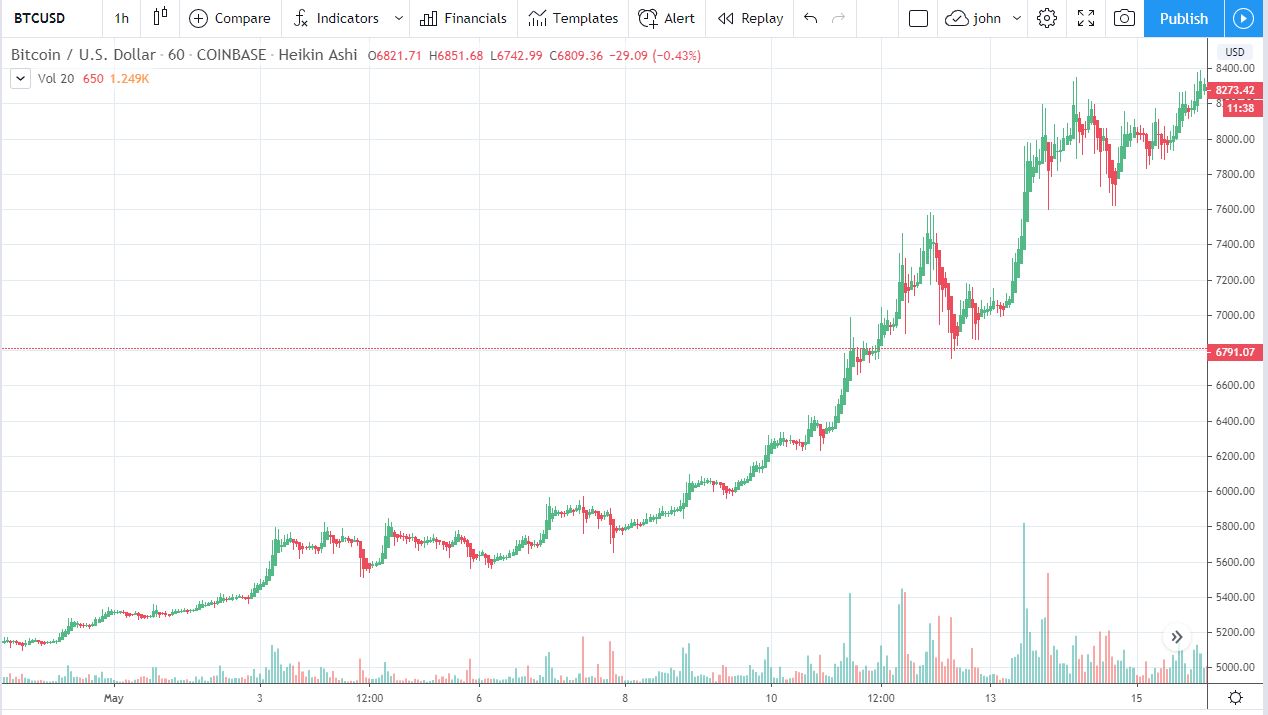
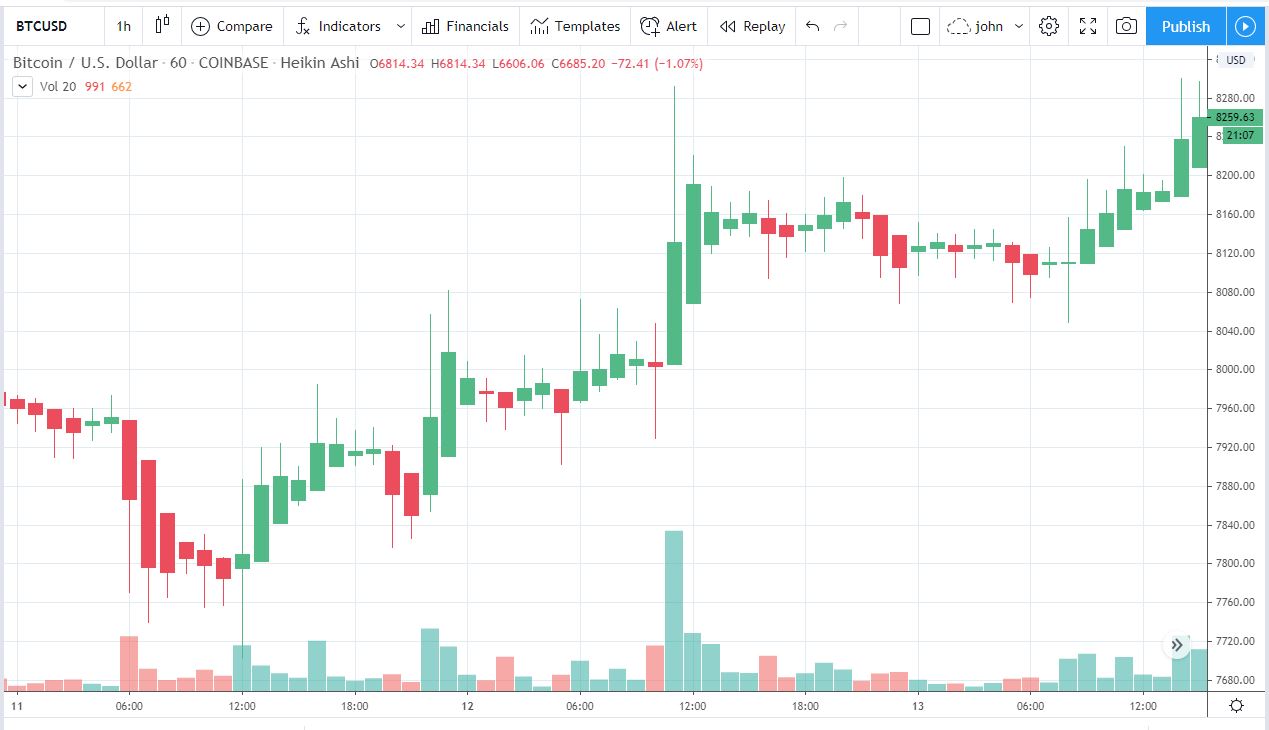
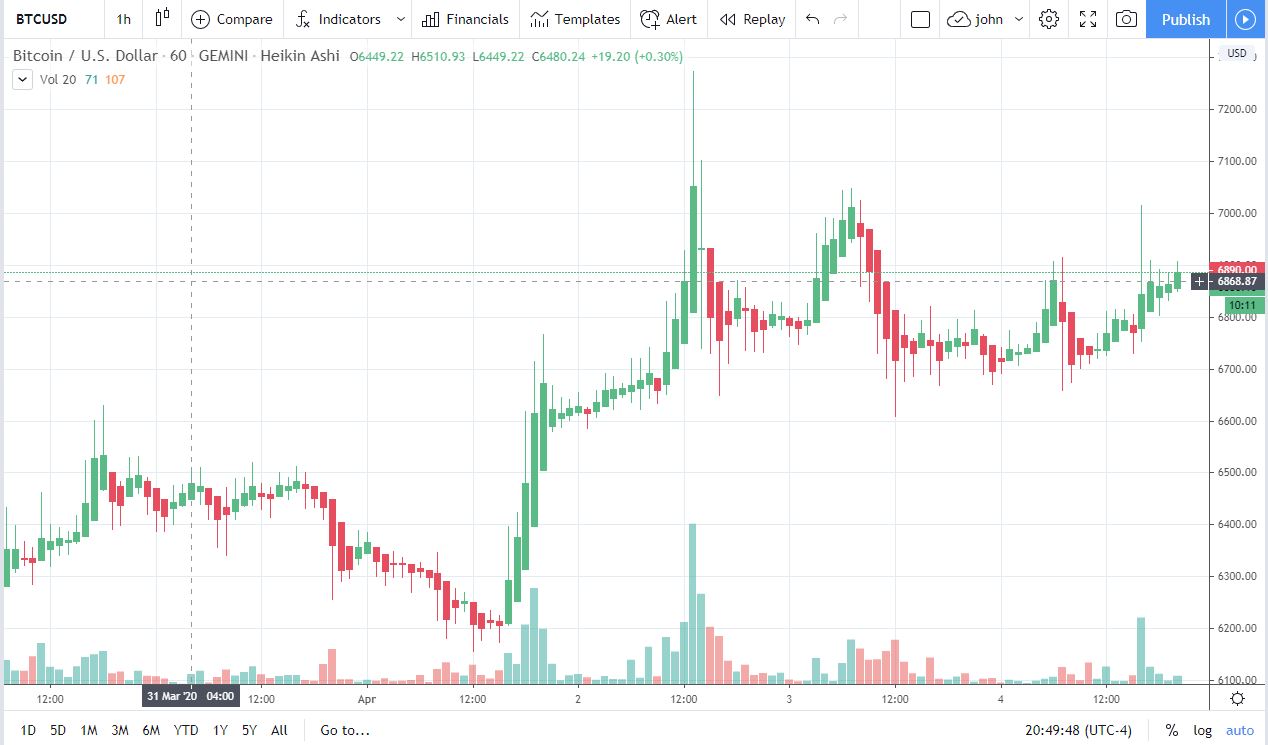
Current Analysis - April 4, 2020 (9 pm EST)
- I feel Bitcoin and Cryptocurrency were having a great year until the Coronavirus occurred. It's clear that global asset sell-off was the major factor for the cryptocurrency market downturn. Fundamentally the Coronavirus has very little impact on cryptocurrencies.
- Central banks are taking historical actions that are increasing debt levels, printing money and following policies that will lead to inflation. This is positive for the long term value of Bitcoin and leading altcoins.
- The use of cryptocurrencies continues to increase.
- The Binance buyout of CoinMarketCap for 400 million dollars is very positive for the financial future of the cryptocurrency trading markets. Expect to hear about more buyouts in the year ahead.
- Our Trend algorithm is currently giving Bitcoin a perfect score (100/100) for all time periods.
This is the current chart pattern. The $6,700 price has been a solid support level for over 48 hours. The $7,000 level has been testing 4 times in the past 3 days. Overall this has the chart pattern often seen before large Bitcoin price surges.
The platform https://quantifycrypto.net/ provides live cryptocurrency prices, technical analysis, news, heatmaps and more. Our flagship product is the trend algorithm, designed to be on the correct side of significant cryptocurrency price moves. We are a new site, please check us out and let us know what you like and do not like about the site.
None of this is meant to be financial advice and I do not have any financial expertise. Although I worked at the New York Stock Exchange for over 23 years, it was as a developer supporting computer systems, not as a stock trader.
Full discloser: I do own Bitcoin and have stock positions.