Enhance Your Website with the Quantify Crypto Heatmap Widget
John Barry | Thu Jun 19 2025
In a digital landscape where attention spans are short and visual impact matters, the Quantify Crypto Heatmap Widget is a powerful tool for website owners, bloggers, and crypto educators. Designed to deliver instant visual insights into the crypto market, this widget adds both aesthetic appeal and real-time value to any site.
Real-Time Market Insights at a Glance
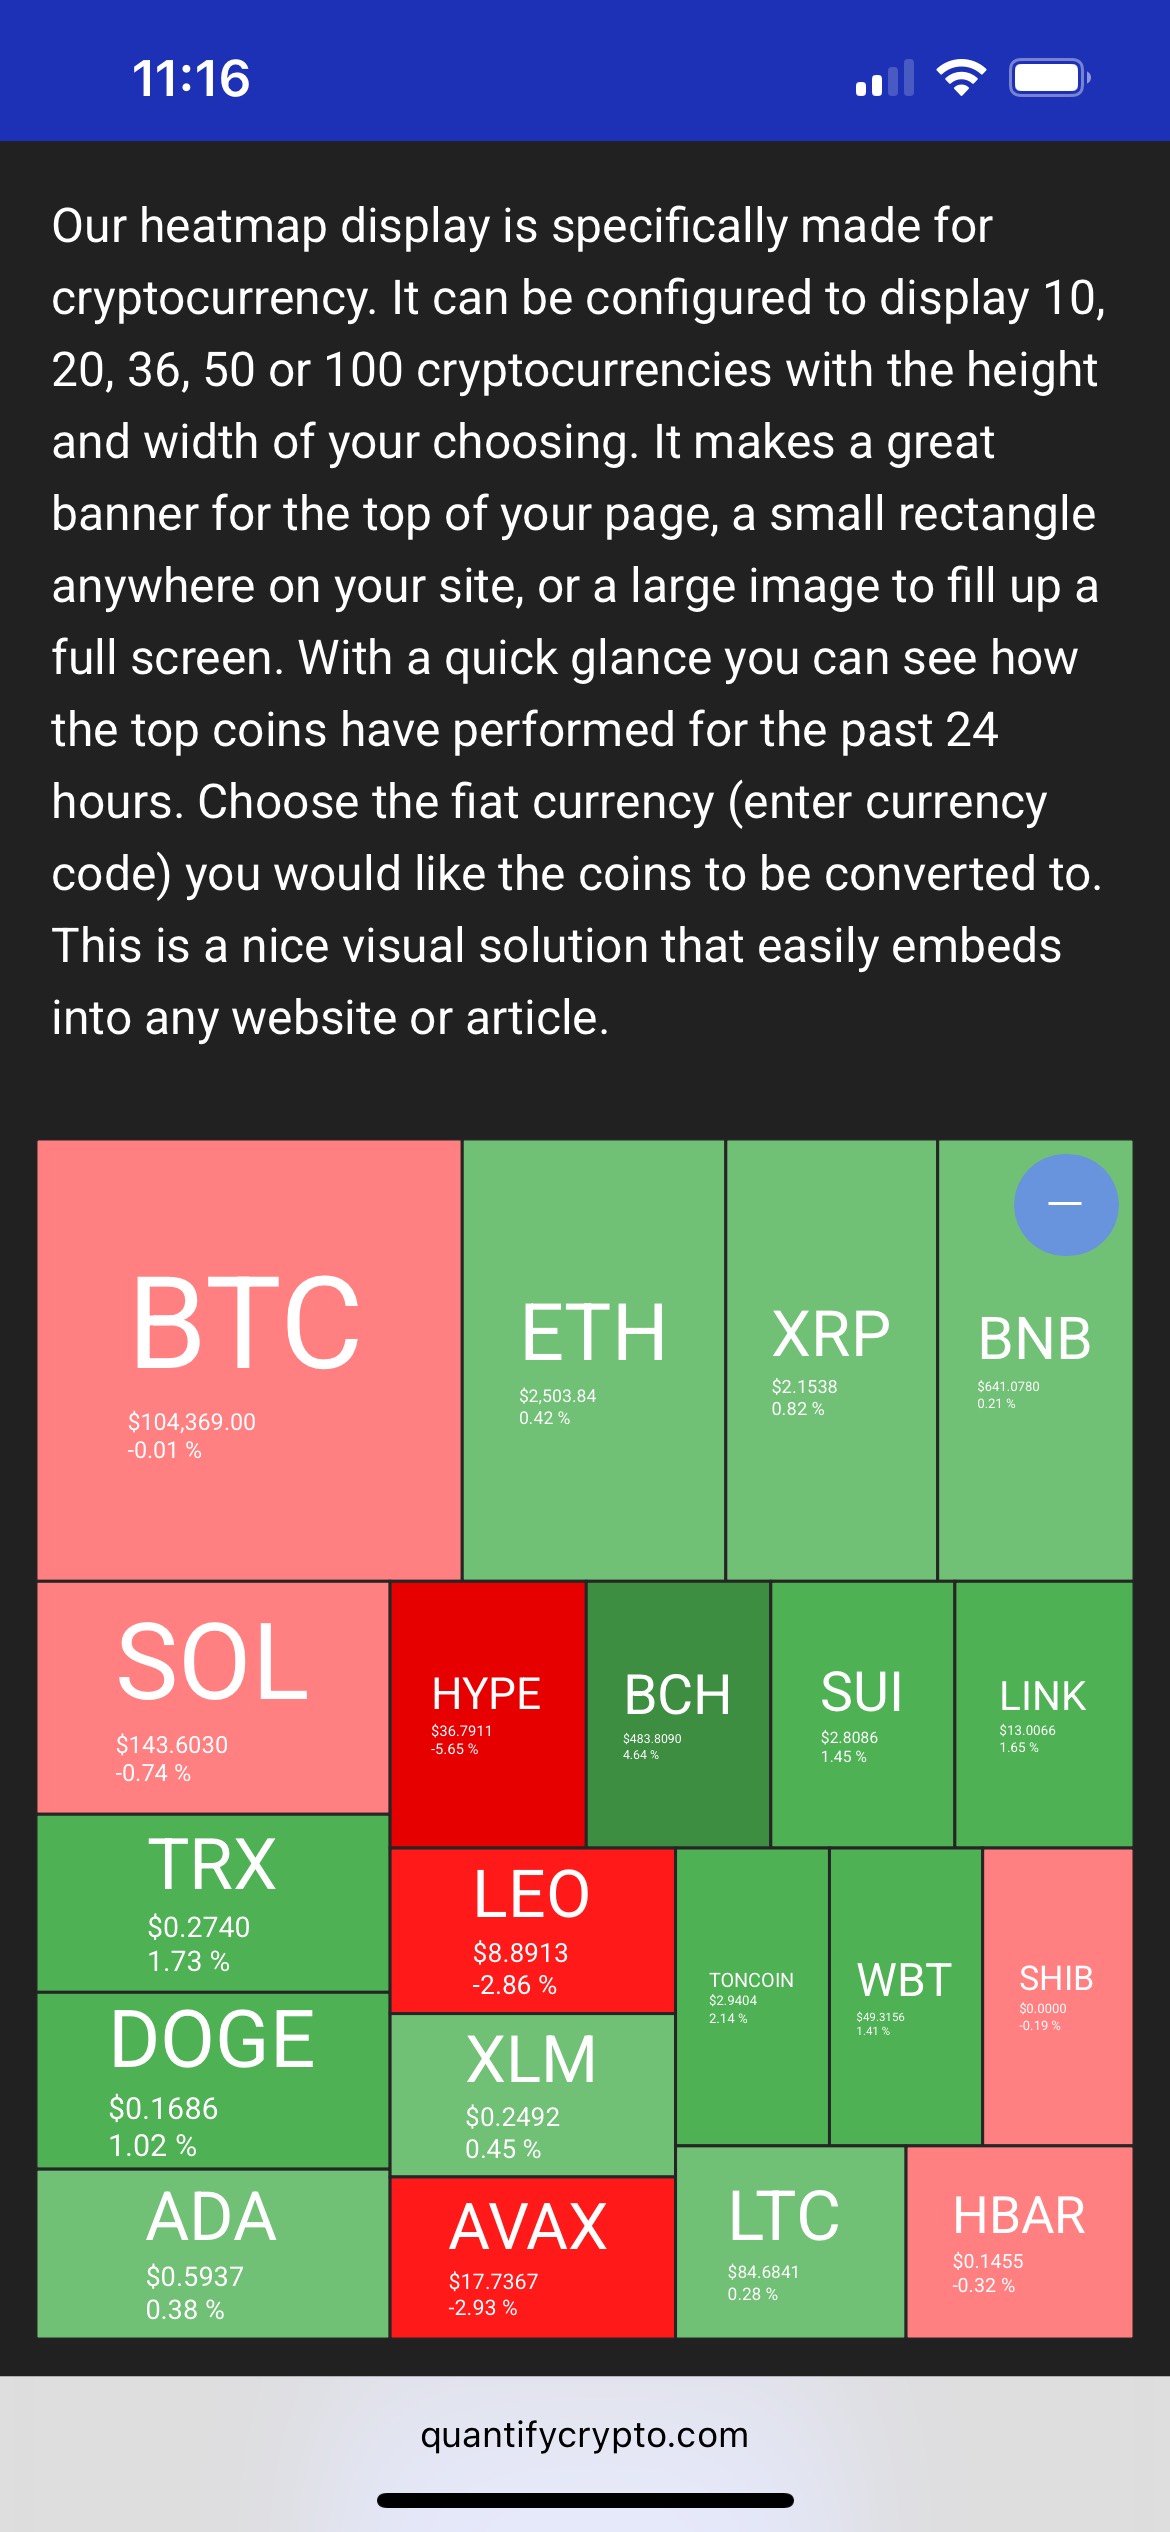
The widget displays the top cryptocurrencies by market cap, color-coded by performance:
-
Green for gains, red for losses — instantly showcasing market sentiment.
-
Hover or tap reveals real-time price changes, 24-hour performance, and asset names.
-
Click-throughs can be enabled to direct traffic back to your site’s internal pages or external resources.
Mobile-Optimized for Seamless User Experience
Unlike many financial widgets that struggle to adapt to smaller screens, the Quantify Crypto Heatmap is fully responsive and optimized for smartphone display. Visitors can easily scroll, tap, and explore top crypto assets without pinching or zooming. Whether your users are on desktop, tablet, or phone, they get a clean, intuitive heatmap interface that automatically resizes for optimal engagement.
Easy Setup and Customization
Installation takes less than 2 minutes. Simply copy the embed code and paste it into your HTML. You can choose the theme (light or dark), number of coins to display, and even adjust the size to fit your layout. It’s plug-and-play — no coding knowledge required.
Try It Out Now https://quantifycrypto.com/widget/heatmap