Why is Nobody Talking about the Largest Rug Pull in History?
John Barry | Wed Jan 21 2026
Crypto has survived spectacular failures before—Terra, Celsius, FTX, countless Memecoins that vanished overnight. But Fasttoken (FTN) may be one of the most alarming collapses in recent history, not only because of how violently it fell, but because of how quietly it happened. A token that once carried a market cap in the billions, traded on major exchanges, and maintained a public “top project” narrative appears to have imploded in late 2025—yet there is still no meaningful mainstream coverage explaining what happened, why it happened, or who was responsible.
This isn’t just a story about a token going down. It’s a story about how a large asset can collapse, how price discovery can break, and how the market can continue to display a “headline valuation” long after real liquidity has disappeared.
Fasttoken Looked “Too Big to Fail”
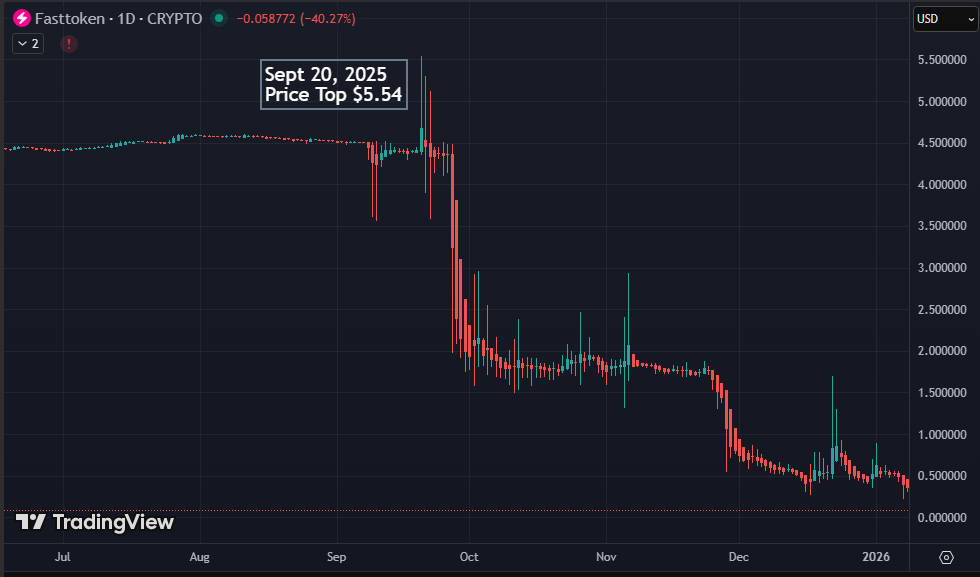
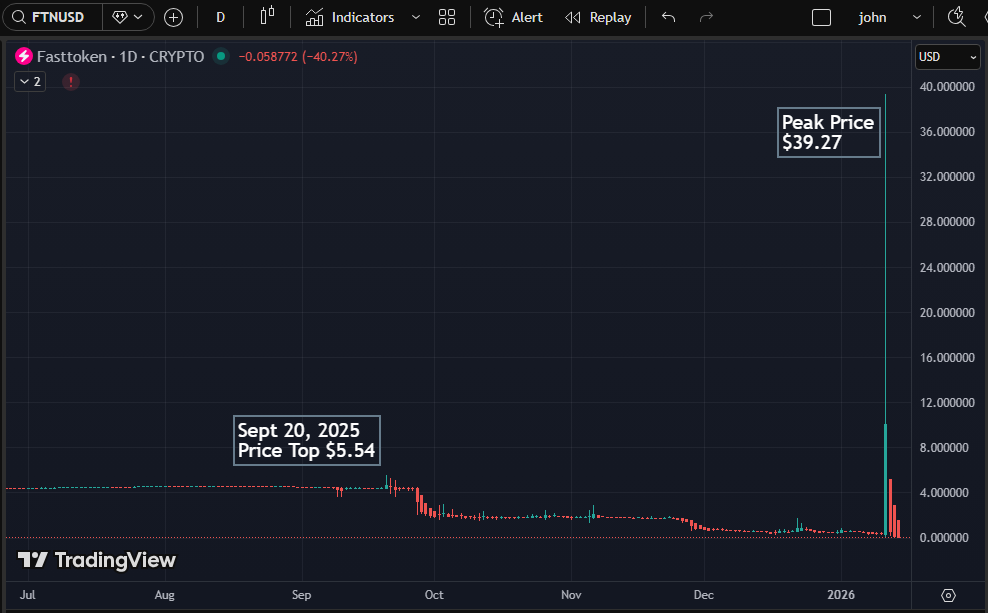
Through the summer of 2025, FTN traded with the appearance of stability and scale. By mid-to-late September, the token was still holding strong levels above $2.00 and printed a local peak around the $5.54 area. To most traders, this is what a major project looks like—strong market cap, persistent demand, and broad exchange access.
Then something changed.
The chart structure began to break, volatility increased, and by late September the market started experiencing the kind of aggressive downside movement that rarely happens without a major catalyst: either a systemic liquidity event, a forced unwind, or something much worse.
The September 2025 Crash: What Happened… and What Still Doesn’t Add Up
The Fasttoken story truly begins in late September 2025 when FTN suffered a major crash that wiped out enormous value in a very short period of time. Quantify Crypto documented the event and the public discussion that followed in this report:
Fasttoken’s Price Crash — What We Saw, What Was Said, What Still Doesn’t Add Up
Want to see how we documented this in real time? We published a short sample report covering Fasttoken’s crash and the key red flags we saw as the situation unfolded. You can read it here: FastToken Sample Report (PDF)Fasttoken Sample Report (PDF). This is a small example of the type of research reports Quantify Crypto provides to subscribers.
The most important detail isn’t just the magnitude of the drop—it’s how unclear the explanation remains. In most major crypto collapses, the market eventually receives a clear narrative: an insolvency, a fraud revelation, an exploit, a leverage unwind, a forced liquidation. In FTN’s case, the price action and subsequent messaging left investors with more questions than answers.
And that uncertainty matters, because uncertainty is where rug pulls thrive.
FTN Was Listed on Major Exchanges… Then It Started Disappearing
Before the collapse, Fasttoken had wide exchange distribution. It was promoted as being listed across multiple centralized exchanges including Gate.io, MEXC, Bitget, WhiteBIT, and Bybit, and it also had visibility through decentralized venues like Uniswap.
That exchange footprint matters because it normally creates competition and liquidity—two things that support real price discovery.
But after the crash, FTN’s exchange presence steadily deteriorated. Over time, Fasttoken was delisted across the major venues it once used to trade on. As listings vanish, liquidity dries up. And when liquidity dries up, price becomes something else entirely: a number on a screen that fewer and fewer people can actually realize.
Gate.io Was the Last Major CEX Exit Door
As the project lost exchange support, the last meaningful centralized venue still associated with FTN appeared to be Gate.io. And once that off-ramp closed, the market entered a dangerous phase: one where traders could still see a price, but not necessarily trade it at scale.
Gate TR issued a public notice confirming that the FTN trading pair no longer met listing standards, that deposits were suspended, and that withdrawals would later be disabled as well.
Once that happens, a token’s market price can become detached from reality—because price discovery is no longer coming from independent, competitive exchanges.
The Market Cap Illusion: $475 Million vs. Reality
Even after delistings and the collapse, major tracking sites continued to display FTN around $1.08, with a market cap near $475 million.
But this is where the story becomes impossible to ignore.
If the last meaningful tradable centralized exchange price was closer to $0.08, then the true market cap isn’t $475 million—it’s closer to $35 million.
That is not a minor discrepancy.
That’s the difference between “major crypto asset” and “small-cap token with no exit liquidity.”
This is where retail investors get hurt the most: because many will trust the number that appears on CoinMarketCap or CoinGecko without realizing that a “headline price” can persist even when the market is no longer truly trading freely.
January 2026: The Pump That Hid the Collapse
By January, Fasttoken was already deep into a prolonged multi-month decline. But then something happened that made the situation even more disturbing: an extreme pump-and-dump event appeared during FTN’s final trading window.
At a time when FTN was trading in a pre-pump range roughly between $0.10 and $0.44, it suddenly spiked to a peak near $39.27—and then collapsed again in a matter of hours.
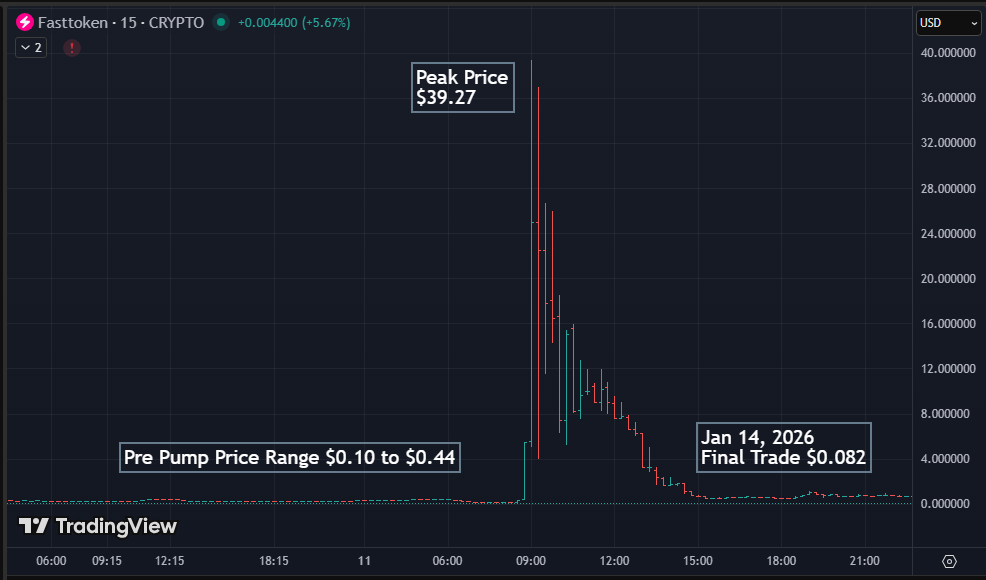
This is the kind of event that doesn’t happen in a healthy market. It looks like what happens when liquidity is extremely thin, order books are unstable, and a single burst of aggressive buying or forced flow sends the price into an artificial vacuum—followed immediately by a collapse when there is no real demand behind the move.
And even worse: that one wick to $39.27 can visually distort the entire long-term chart.
That’s not just a chart problem. That’s a price discovery problem.
Why Was There No Mainstream Coverage?
In a market where billions can evaporate overnight, the biggest stories usually attract the loudest headlines. Yet searching for major reporting on FTN’s September crash produces mostly surface-level results: exchange pages, token unlock narratives, ecosystem announcements, and promotional-style headlines—while direct investigative reporting about the crash itself is nearly impossible to find.
That silence is part of what makes FTN so unsettling.
If a token can rise into the billion-dollar tier, collapse violently, vanish from major exchanges, and still maintain a large “headline market cap” on trackers—without the crypto media demanding clarity—then the real issue goes far beyond Fasttoken.
So Was It a Rug Pull?
Calling something a rug pull is serious. Not every crash is fraud. Markets can collapse for many reasons: leverage unwinds, liquidity shocks, delistings, coordinated exits, or structural design flaws.
But Fasttoken checks too many of the boxes that investors associate with rug pull outcomes:
-
huge valuation at peak
-
violent, unexplained collapse
-
disappearance from major exchanges
-
market cap / price tracking disconnect
-
final days marked by abnormal “wick” behavior
-
minimal mainstream coverage afterward
Even if FTN was not a classic rug pull in the strictest definition, it may still represent something equally dangerous: a major token whose market structure broke so badly that pricing became unreliable and the exit liquidity evaporated.
Final Thoughts: Why This Matters
Fasttoken is not just a chart story—it’s a warning. It shows how quickly credibility can collapse, how exchange delistings can trap investors, and how market cap can become a misleading metric when a token loses real liquidity.
If FTN can trade like a multi-billion-dollar asset one month and then collapse into a situation where only a narrow ecosystem still quotes it, the lesson is clear:
In crypto, a price is not always a market.
And a market cap is not always real.
So the question remains:
Why is nobody talking about what may be the largest rug pull in history?