Why RSI Doesn't Work for Crypto the Way it Works for Stocks
Alex Wason and John Barry | Thu Jun 11 2020
RSI, or Relative Strength Index, is a very useful tool when trading stocks or cryptocurrency. Put simply, it is a formula that is used to help gauge how stable a stock or coin is at a given moment. You can make changes to the formula if you’d like, but RSI is traditionally set up to show when RSI goes over 70% that means the asset is overbought, and it is oversold when RSI goes under 30%.
When you’re trading stocks, conventional wisdom says you should be selling when RSI is over 70% because the price is high and about to go back down. On the other hand, you should be buying when the RSI is under 30% because the price is low and about to go back up. However, things aren’t exactly the same when using RSI to trade cryptocurrency. We at Quantify Crypto believe it is not a good idea to simply apply stock indicators to cryptocurrency and expect them to work the same way.
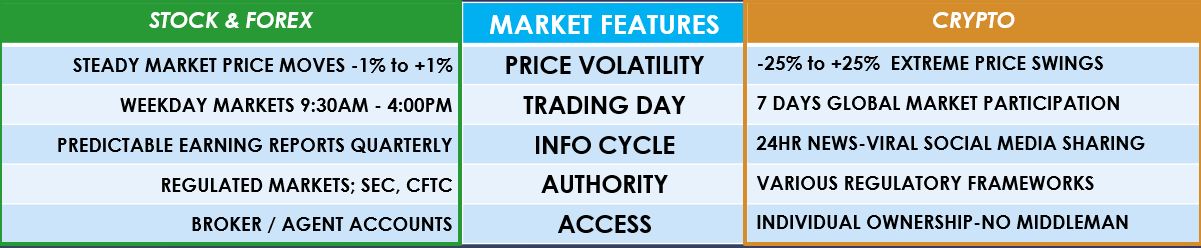
As you can see in the table above, there are quite a few big differences between stocks and cryptocurrency. The most important thing to take into consideration is the massive differences in price volatility. Cryptocurrency and stocks are different animals, so it makes sense that RSI won’t necessarily work the same way for both.
At Quantify Crypto, we have a thesis regarding how RSI should be used for cryptocurrency. We believe that when RSI goes over 70% for Bitcoin, it is typically a bullish sign for the coin, and when it goes under 30% it is a bearish sign. Obviously this is the opposite of how it’s supposed to work with stocks, but here are two charts from this week that show what we’re talking about. The first chart has 5-minute candlesticks with the RSI from June 5, 2020.
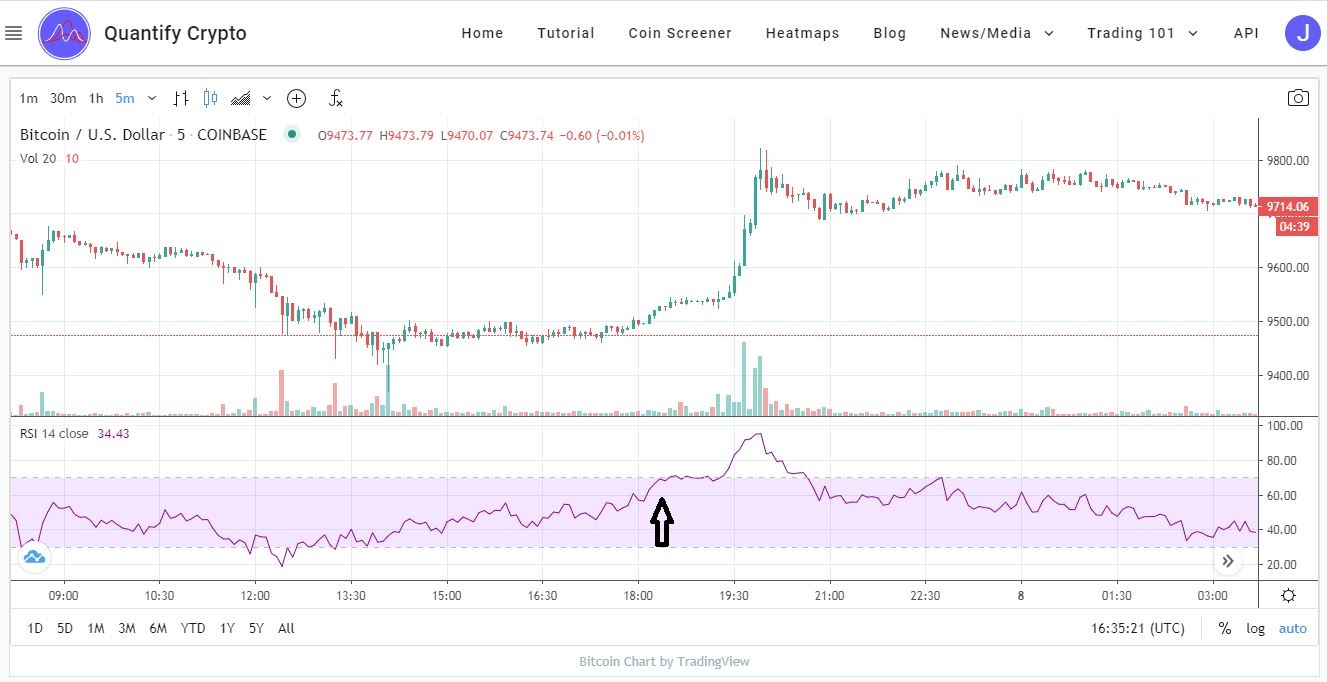
As you can see with the arrow indicator added to this chart, Bitcoin’s RSI touched 70% and later goes above 70%. However, the price of Bitcoin goes up from ~$9,500 to $9,800. Clearly, this 5-minute RSI was a bullish sign for Bitcoin. Let’s look at another chart from June 11th, 2020.
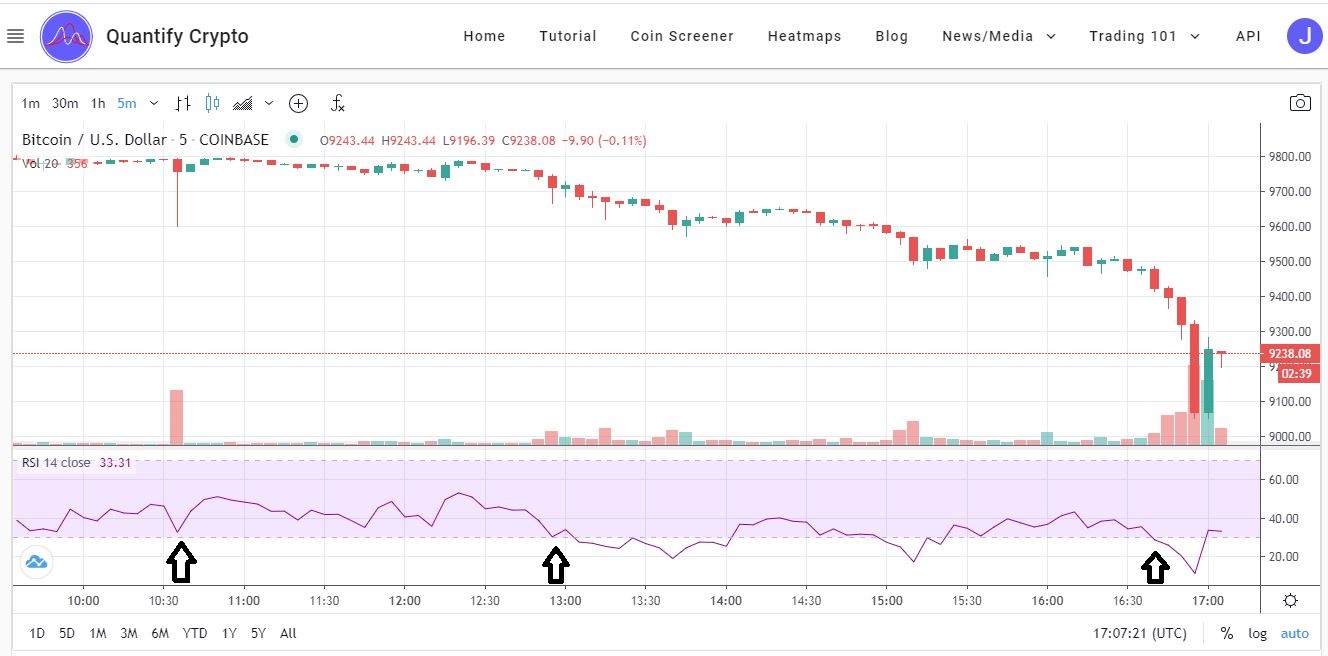
As you can see in this chart at the first arrow, Bitcoin’s RSI almost reached 30% with its price at $9,800. A few hours later at the second arrow, the RSI has touched 30% and the Bitcoin’s price is now $9,700. Moving to the 3rd arrow, the Bitcoin price has continued its decline and the RSI again is at 30%. After that, the price spikes downward hitting a low price of $9,070. What would typically be a bullish sign for stocks is the exact opposite for crypto. This is especially true for the lower time frames (2 hour candlesticks and less) for the RSI indicator.
It may seem confusing how the same indicator can lead to such different results when trading cryptocurrency as opposed to trading stocks, but with so many differences in the nature of the assets themselves, you have to expect there to be some dissonance. Regardless, RSI is definitely a good indicator to use for trading both stocks and crypto, just try to keep in mind that the percentages won’t always lead to the same thing.
The last point to make is that short time frame metrics are critically important for assets that trade with high volatility like Bitcoin.
The platform Quantify Crypto provides live cryptocurrency prices, technical analysis, news, heatmaps and more. Our flagship product is the trend algorithm, designed to be on the correct side of significant cryptocurrency price moves. We are a new site, please check us out and let us know what you like and do not like about the site.
None of this is meant to be financial advice and I do not have any financial expertise. Although I worked at the New York Stock Exchange for over 23 years, it was as a developer supporting computer systems, not as a stock trader.
Full discloser: I do own Bitcoin and have stock positions.