A Decade of Highs: Bitcoin Halving's 10-Day Countdown 2024
John Barry | Tue Apr 09 2024
With the Bitcoin halving only ten days away, anticipation is building and media coverage is sure to increase. Key questions reviewed are:
- What does history indicate for the future of Bitcoin after the halving?
- How does Bitcoin pre-halving price movement compare to the prior two halvings in 2016 and 2020?
- Will the Bitcoin halving turn into a “Sell the News” event?
- Crypto continues to have a postive trend
The Bitcoin Halving Years
Significant price increases have occurred prior to and following Bitcoin halvings. Specifically, one year before the 2016 halving, Bitcoin achieved a 1011% increase until its peak on April 14, 2021. Four years later, Bitcoin increased by 795% from May 11, 2019, to April 24, 2021. Historically, Bitcoin achieves most of its gains in the two-year period surrounding the halving and tends to underperform during the other two years of the four-year cycle.
With only 10 days until the next Bitcoin halving, the upcoming year could be highly favorable based on historical patterns.
Bitcoin Halving Price Comparison
The following chart shows the price performance of the current Bitcoin Halving setup 10 days prior to the halving and the halving setup 10 days prior to 2016 and 2020. Significant is how similar the 2016 price performance is to the 2024 price setup. While the 2020 price setup is not the same, a key point is the Covid market crash occurred.
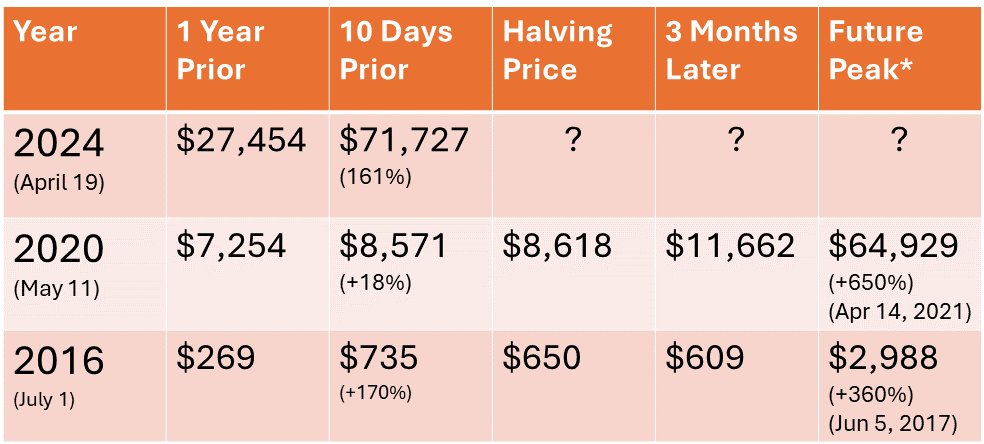
Comparing the post Bitcoin halving performance shows significant gain occur in the 3 to 9 month period after the halving occurs not at the actual time of the halving.
Will the Bitcoin Halving turn into a “Sell the News Event” ?
In the stock market, there are many significant new events that often lead to significant selloffs. Often, you hear the phrase “Buy the rumor and sell the news” associated with stocks. This means that the buildup to these events is when significant increases occur. After the news is out, there will not be another significant news event in the short term that will be as impactful, so this often leads to a selloff.
However, that is for stocks, not for crypto. There are many stock indicators that work great for stocks but completely fail when it comes to crypto. Many feel the reason for this is crypto whales. Crypto whales track the metrics professional stock traders use and will often set up market conditions contrary to what a stock professional may expect, leading to liquidations of hedged positions. A key example of this is the “Death Cross,” when the 50-day moving average crosses under the 200-day moving average. Many stock professionals have made significant amounts of money shorting stocks when a death cross occurs for a stock.
When Bitcoin “Death Crosses” have occurred in the past, instead of Bitcoin going down in price, there is a history of significant price increases when Bitcoin death crosses occur. A big reason for this is the hedged positions put into place before Bitcoin death crosses occur, leading to a trader being forced to trade buyback when the liquidation to the hedge position occurs.
So, getting back to the halving, the possibility is there that a short-term trend may occur before the halving with the possibility of some traders being on the wrong side of a trade expecting a “sell the news” type of play.
Key Bitcoin Halving Points:
- Comparing today’s price, 10 days before the Bitcoin Halving, shows a similar price increase (161%) has occurred up to this point as in 2016 (170%).
- Noteworthy is the under performance from 2020, a key reason for this could be the overall Covid market asset crash that occurred in March 2020 due to significant fears and concerns. Bitcoin would reach a low of $4,000 on March 12th.
- Comparing the 1 year prior to the post halving price peaks show a similar result for both 2016 and 2020.
- Due to the much larger market cap, liquidity, and trading volume today, it will be challenging to achieve similar exorbitant gains on a percentage basis. However, price history does show that a significant gain may occur.
- Many metrics used for stock price predictions often do not work for Cryptocurrencies.
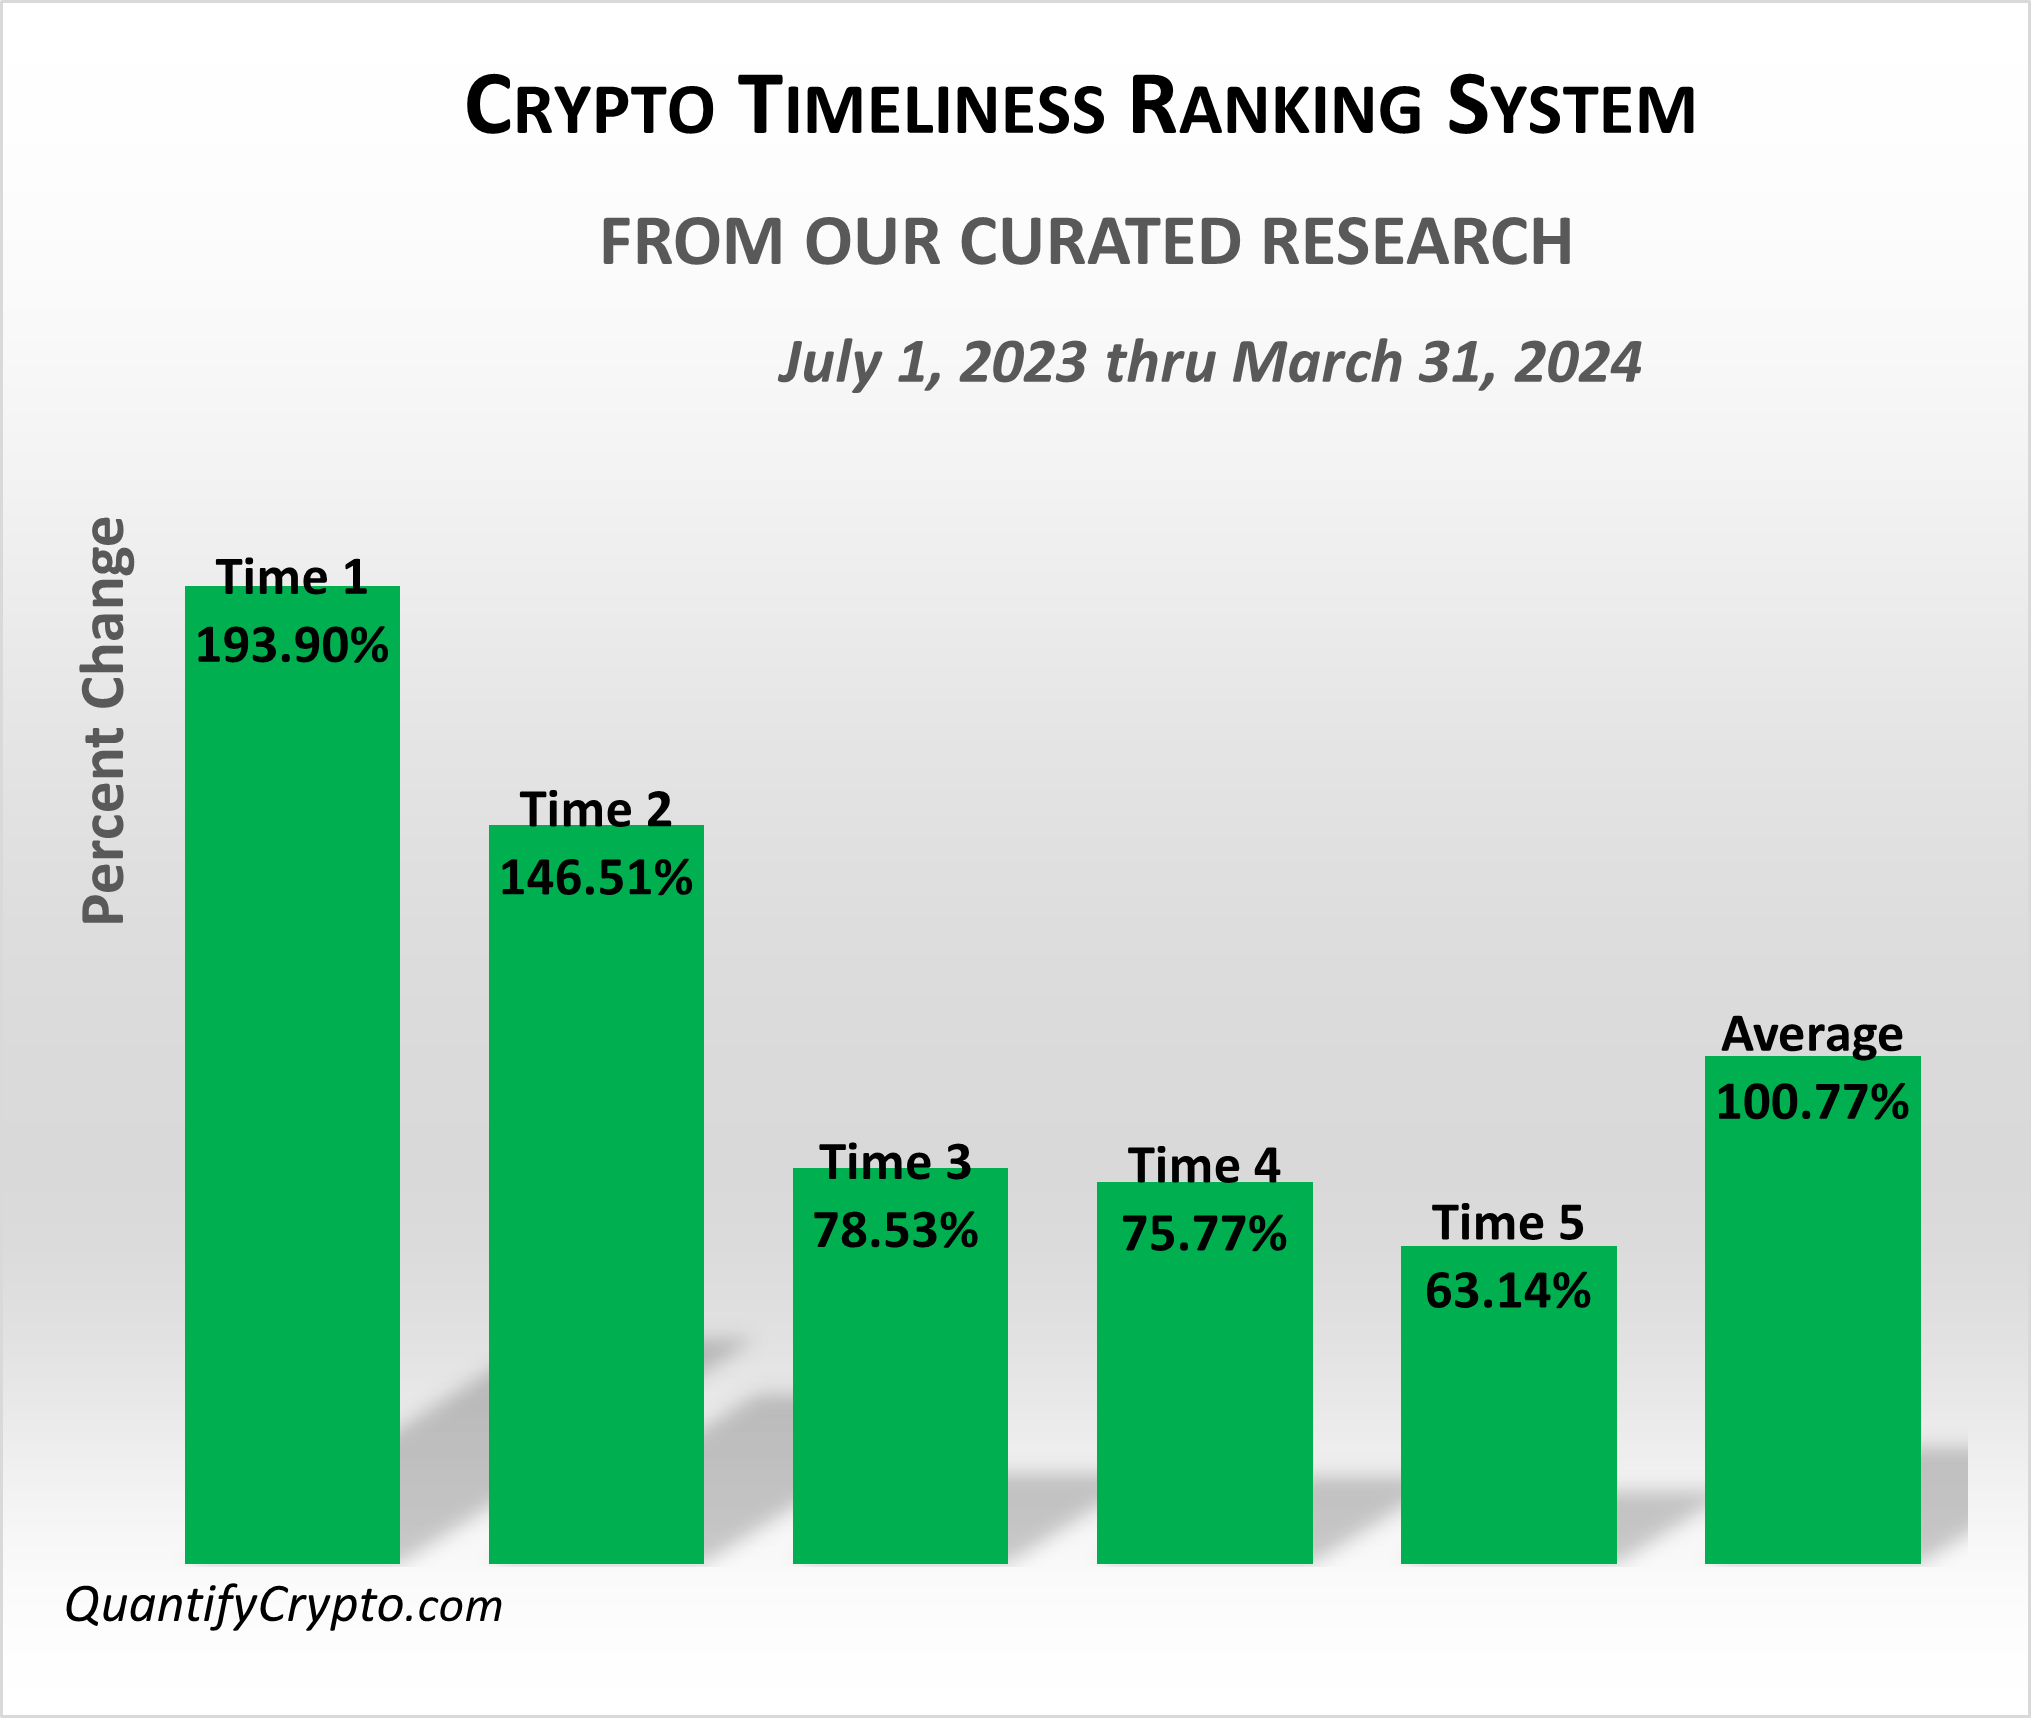
Meanwhile, trading continues and March was another good month for crypto
As the crypto chart at the beginning of this article shows, in March the average cryptocurrency was up 24%, this comes after the average crypto was up 31% in February.
The Quantify Crypto research reports for 85 of the top cryptocurrencies with timeliness and fundamental rankings have proven to be very accurate.
Quantify Crypto's research reports offer comprehensive insights into leading cryptocurrencies. Each report features:
Fundamental Ranking - This evaluates the overall performance and potential of a cryptocurrency relative to its peers. Through rigorous analysis, each cryptocurrency is placed within one of five tiers based on multiple criteria. Our tier distribution ensures fair representation, with each grouping containing 20% of the total, aligning with our business model checklist.
Timeliness Score - Provides insights into the cryptocurrency's current momentum and immediate prospects. This metric integrates historical price performance, current trends, project developments, and external factors, offering an in-depth understanding of the currency's market position. Unlike our ranking system, which compares positions within the top 50, the timeliness score is based on the individual criteria measurement of each cryptocurrency. Uneven distributions across tiers are common, particularly in market conditions showing collective bullish or bearish trends.
Background and Fundamentals - The 'Background' section explores each cryptocurrency's inception, founding principles, and initial vision. The 'Fundamental' section details how the cryptocurrency functions, highlighting its unique features, technological framework, and functional attributes.
Recent Impactful News - Covers significant news affecting the protocol, business model, user base, and legal aspects. This may include key statistics indicating the project's strengths or weaknesses.
Price Analysis - Reviews price charts for the entire history of the cryptocurrency and the latest year, comparing it to Bitcoin's performance and the overall crypto market.
Overall Summary - Combines all above sections and rankings to provide a comprehensive snapshot, empowering readers to make informed decisions. This summary reviews key current aspects of the researched project, offering actionable insights.
To lean about Quantify Crypto subscriptions this link can be used https://quantifycrypto.com/plans
Disclaimer
Quantify Crypto is an informational website that provides research reports, market data, technical analytics and links to news and commentary sources. Information published on Quantify Crypto platform should not be taken as investment advice in any way. Quantify Crypto is not an investment adviser and you agree not to site the Quantify Crypto platform or content as the reason or cause for making any trading decisions. Quantify Crypto is not accountable, directly or indirectly, for any damage or loss incurred, alleged or otherwise, in connection to the use or reliance of any content you read on the site. You agree not to consider the information on Quantify Crypto platform as a solicitation to invest in any cryptocurrencies, initial coin offerings, or other financial instruments.