Are Markets going to Crash?
John Barry | Sun Mar 01 2020
On October 19, 1987, I worked for a financial services company in Danbury, Connecticut; but all eyes that day were focused on the stock market crash occurring on Wall Street. The Dow Jones Industrial would lose 22.5% of its value that day, making it known as “Black Monday”. Even though I had only a small holding in the stock market, the lessons learned from the crash remain with me. One important lesson is to always have cash on the side ready to invest, more on that later.
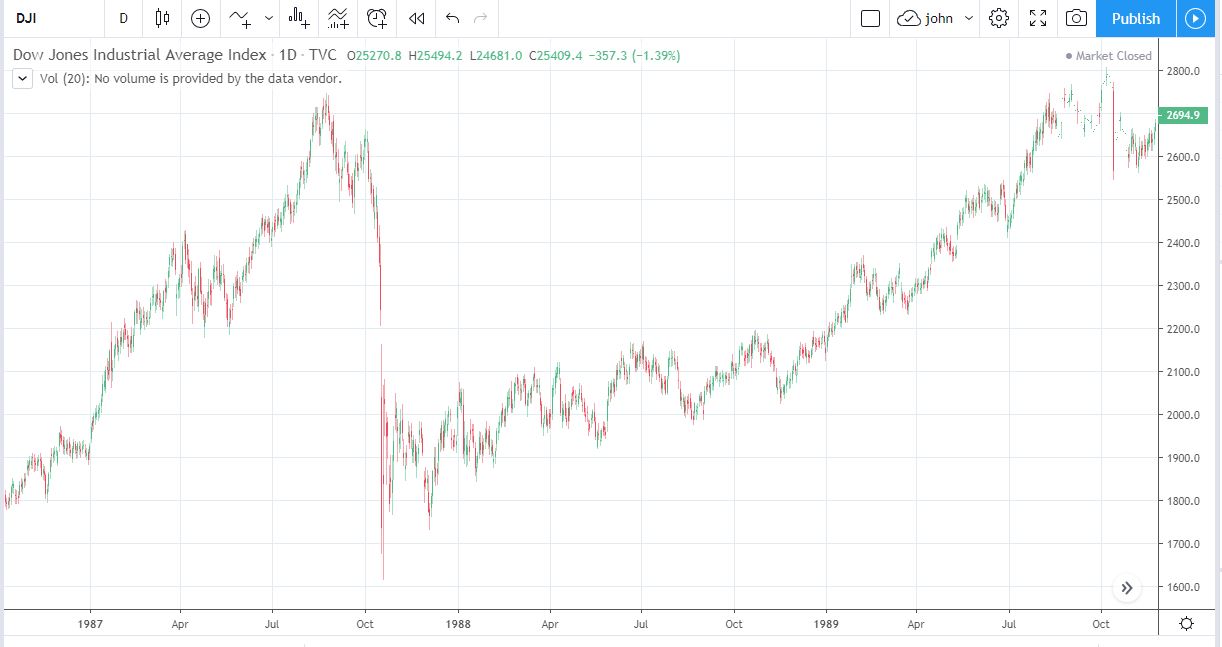 The Dow Jones Industrial Average 1987 Chart Source: TradingView
Thus far, 2020 has been a brutal year for the oil market, which is down 26.02 percent since Jan 1st. It was already having a bad year before the global asset selloff. With the prospect of reduced airplane and cruise ship travel due to the Corona Virus, along with a sharp reduction in operating factories in China; many are predicting a glut for the oil supply. Unfortunately, it is hard to see oil having a quick recovery since global demand needs to increase for this.
| Opening Price | Closing Price | YTD Change | Percentage | |
| DJIA | $28,084.57 | $25,409.00 | -$2,675.57 | -10.53% |
| S&P 500 | $3,176.08 | $2,954.22 | -$221.86 | -7.51% |
| Nasdaq Composite | $8,954.62 | $8,567.37 | -$387.25 | -4.52% |
| Dow Transport | $9,726.54 | $8,567.37 | $9,388.19 | -13.53% |
| Gold | $1,527.10 | $1,586.45 | $59.35 | 3.89% |
| Bitcoin | $6,891.72 | $8,580.33 | $1,688.61 | 19.68% |
| Oil | $61.18 | $45.26 | -$15.92 | -26.02% |
The asset selloffs last week are significant (see above), however, this may only be the beginning. The Corona Virus is impacting manufacturing in China, which will cause a disruption in the supply chain affecting necessary components for finished goods.
A stock market bubble is often hard to see until it bursts. Often there are irrational valuations in a bubble. I’m a fan of Tesla, however, the stock price it trades at is ridiculous. On Feb 19th it hit a high of $917 per share; in part due to a short squeeze. Tesla has a higher capitalization (123.17 billion) than GM (43.5 billion) and Ford (27.6 billion) combined. Last year Tesla lost over $5.00 per share, GM earned $4.57 per share and Ford earned $0.03 per share. I agree Tesla has a bright future, but at some point, earning (or lack of earnings) must mean something. There are stocks trading similar to Tesla, having negative or weak earnings, that many consider overpriced.
Facebook stock is down 12.3 percent since Feb 18th due to the general market selloff. A key question is why? I do not think Facebook has that much manufacturing occurring in China (Oculus Quest maybe?). Last I checked Facebook was still banned in China. If a pandemic were to occur (which I do not think will happen), one would suppose people will stay home and engage more with social media, including Facebook. Fundamentally it’s a hard argument to say Facebook’s price is down due to the Corona Virus.
When people are overly exuberant, stock prices can get over-inflated. The stock market has never had a bigger spotlight than it does now, every new market high gets tweeted about by President Trump. This has led to a feeling of nothing is going to stop this stock market from going higher. One of my observations is that Wall Street always over-reacts. This happens on the buying side and the selling side.
Psychology plays a big role in market movements. When people feel the markets will go higher, they buy. As markets go higher, they buy more. To buy more, they trade on margin. When the markets go down sharply, they must pay and closeout those margin positions. This is where gold comes into the story. Gold is a proven safe haven. After one of the worse weeks in history for the stock market, gold was having one of its best weeks. On Friday that changed, as Gold proceeded to have one of its biggest one day falls in its history. Why would one of the safest assets have such a big loss? It appears traders were choosing to sell gold to cover and close their losses in stock margin positions. After depleting stable assets, how will they close their next margin call? Probably by selling more stocks.
The Dow Transportation Index (DJT) was down 13.9% last week, erasing gains it had achieved in 2020. On a more troubling note, it has broken its yearly support level of $9,750. Multiple times in 2019 (see yellow support range below) the $9,750 level was rock solid. Last week the DJT completely broke under the lower Bollinger Band. Currently, I do not see any support level. Oil markets are down due to decreased demand. I see more pain for the DJT. I know in theory lower fuel prices are desirable for airlines and the cruise industry, but empty planes or ships are a worse scenario.
![]()
Chart source: TradingView
Why is the DJT significant? Let’s return to the crash setup of 1987. On Oct 6, the DJT was trading at $1,069; or 3% lower than its all-time high set two months earlier. That day, the DJT started heading downward until it hit a price of $939 on Oct 16th down 12%. On Oct 19 and 20th it went on to hit a low of $651 before having a price recovery. Dow Theory states that the Dow Transport Index is a leading indicator for the Dow Jones Industrial average. The Black Monday crash re-enforced this philosophy. Clearly this is an index that needs to be monitored closely.
While Black Monday is referred to a lot, the lessons I learned from Tuesday, Oct 20th, 1987 are just as significant. On Oct 20th, The Dow Jones Industrial Average opened at $1,738 and rose to $2,067 during the first hour of trading. Then the market took a downturn, dropping to $1,616. Saving the stock market was the rebound in the late afternoon, leading to a market close of $1,840. The price of $1,616 would never be seen again, as the market would start a multi-year bull run. Some called the decline from August to October the shortest bear market in history. Buying in following the panic drop was the smart move to make.
Since I am a cryptocurrency enthusiast, I’d like to talk about crypto. Bitcoin and the cryptocurrency market make a strong case for why you should invest in multiple asset classes. Even with last week’s losses, Bitcoin is still up 20% in 2020 and other digital assets in the top 50 outperformed Bitcoin significantly.
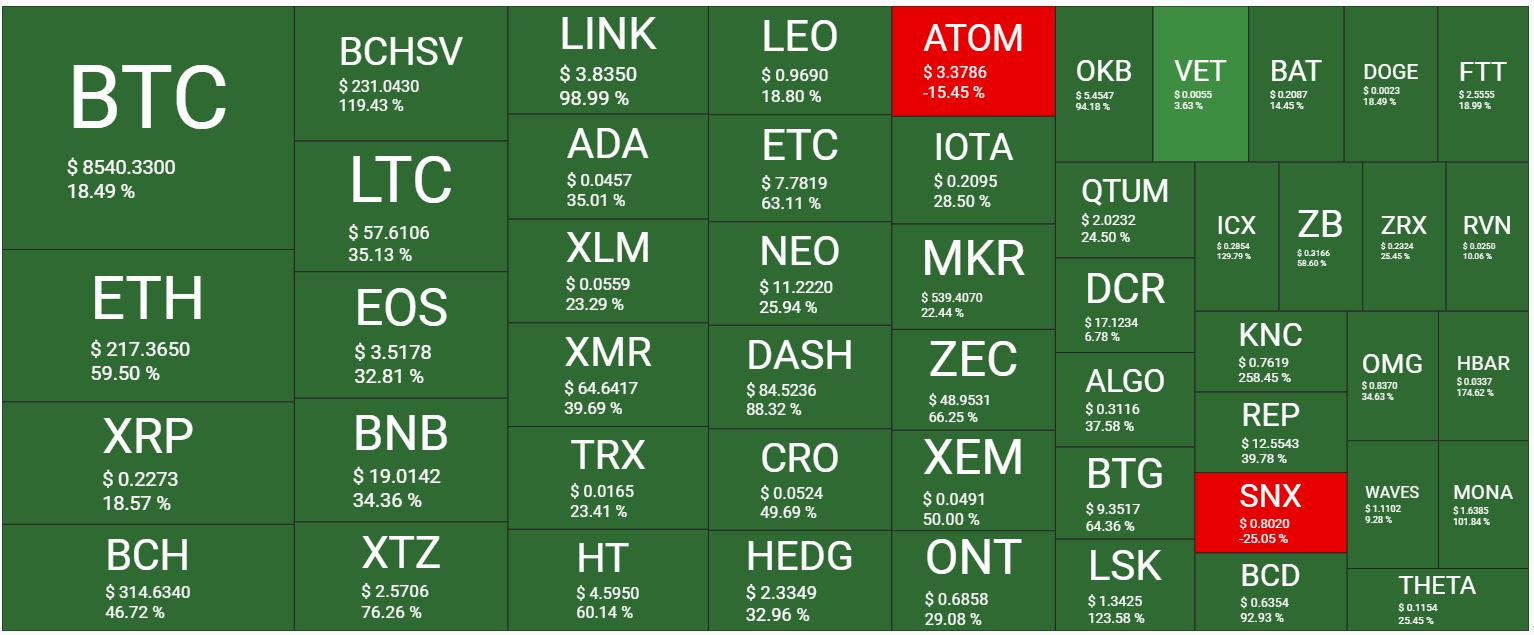 Year to Date Heatmap: QuantifyCrypto.net
The cryptocurrency markets are extremely volatile. You can bet, on a percentage basis, the crypto market will go down more than the stock market. The “buy the dip” opportunity will be too good to pass up. Also, the Bitcoin halving is estimated to occur this spring on May 12th. The Bitcoin supply which is mined daily is about to be reduced by 50 percent. Many pundits say this is a fundamental reason to be buying Bitcoin now. The transformative prospect of blockchain technology is great and is expanding.
In summary
- The Corona Virus has caused global markets to decline. Fear is likely to continue until the spread of the virus slows down or other positive news occurs.
- Downturns in oil markets and the Dow Transportation Index are warning signs.
- There are irrational prices of some flagship stocks in the market.
- The positive mindset that existed before the Corona Virus outbreak, which lead to market increases, has turned 180 degrees to a negative sentiment.
- Sell off in gold and cryptocurrency may be due to cash requirements needed to close long margin calls
- There were big market drops warning signs in 1987 before Black Monday, before the most severe declines occurred. Are these the same warning signs here in 2020? Do bigger price declines await us?
- On a percentage basis, the cryptocurrency market is likely to fall the most and to rebound the most.
- It’s always safe to have cash on the side, especially when so many risks exist.
- Be ready to buy the dip, if a crash occurs.
None of this is meant to be financial advice and I do not have any financial expertise. Although I worked at the New York Stock Exchange for over 23 years, it was as a developer supporting computer systems, not as a stock trader.
Full discloser: I do own Bitcoin and have some stock positions.
The QuantifyCrypto.com platform provides live cryptocurrency prices, technical analysis, news, heatmaps and more.