Bitcoin Death Cross of 2021 - Why its Bullish
Lisa Coppola and John Barry | Wed Jun 09 2021
2021 has been an exceptional year for Cryptocurrency. Presently the leading cryptocurrencies are off their yearly highs, however the heatmap below, shows tremendous year to date gains.
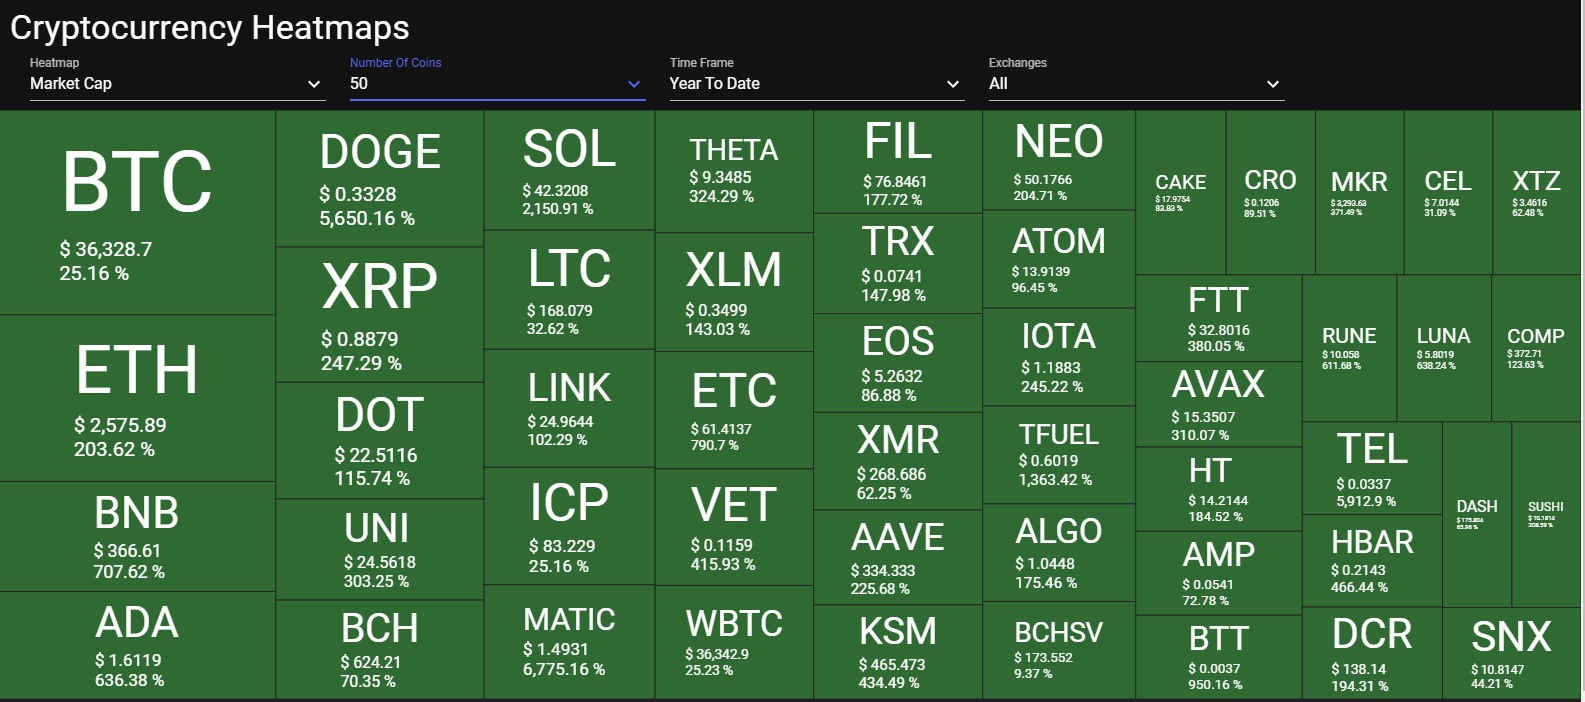
Bitcoin has the 2nd worst YTD performance of the 50 top cryptocurrencies, trading 50% off its April 14 high price of $64,736. This is due to Bitcoin being the leader and was one of the best performing crypto assets for the second half of 2020. Multiple factors have led to Bitcoin’s decline: Elon Musk flip flopping support of Bitcoin, Chinese news about banning Bitcoin (again), a reduction of institutional buying after Coinbase went public and of course Crypto Whales selling.
We expect Bitcoin will continue to trend lower until around June 23rd. We feel this is the perfect setup for a bear trap to occur. A large part of this will be due to the media attention over the upcoming Bitcoin death cross as “experts” declare Bitcoin prices will be in severe danger. This article will explain what the Bitcoin death cross is, when this will occur, what has happened during previous death crosses, and how Crypto Whales may maneuver for this. We end with a prediction of where the Bitcoin price will move to.
What is a Death Cross?
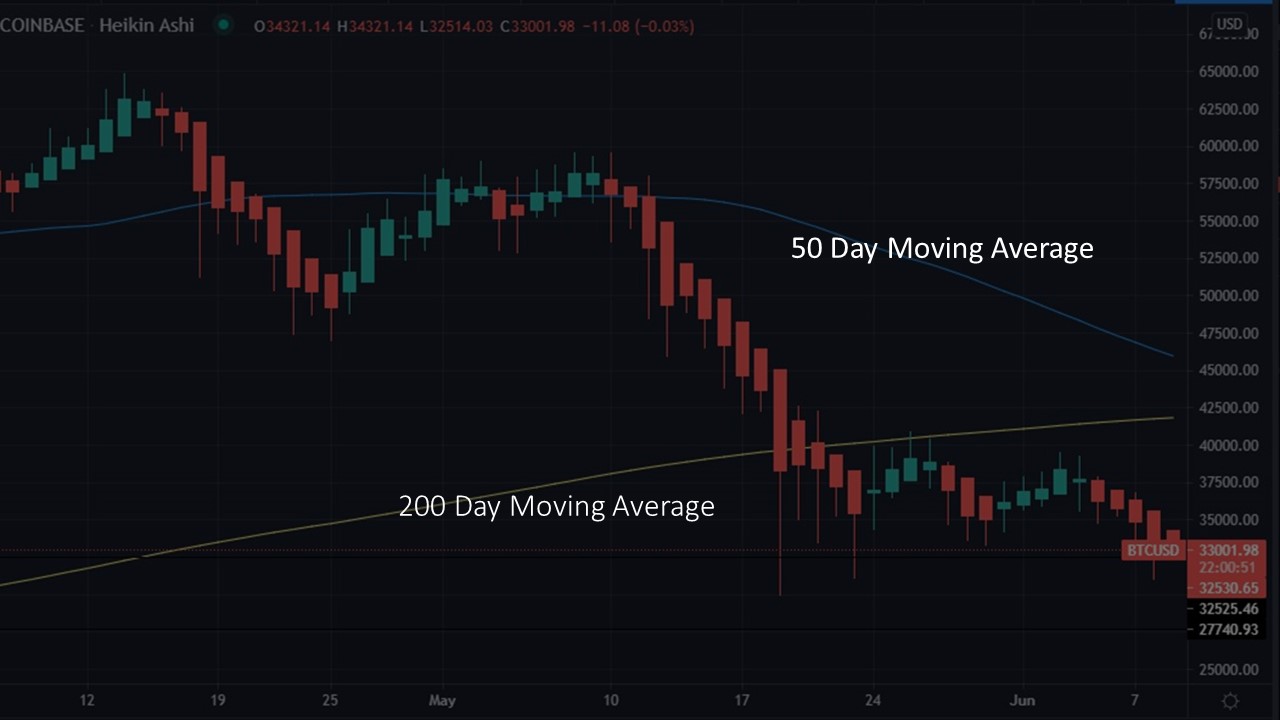
The death cross is a technical chart pattern that indicates a bearish trend for a stock. The death cross occurs when a stock’s 50-day moving average falls below its 200-day moving average. On a price chart, you can see the death cross when the 50-day and 200-day moving average lines connect.
Here is an example of a death cross that occurred on February 3rd, 2020 for the United Airlines Holdings.
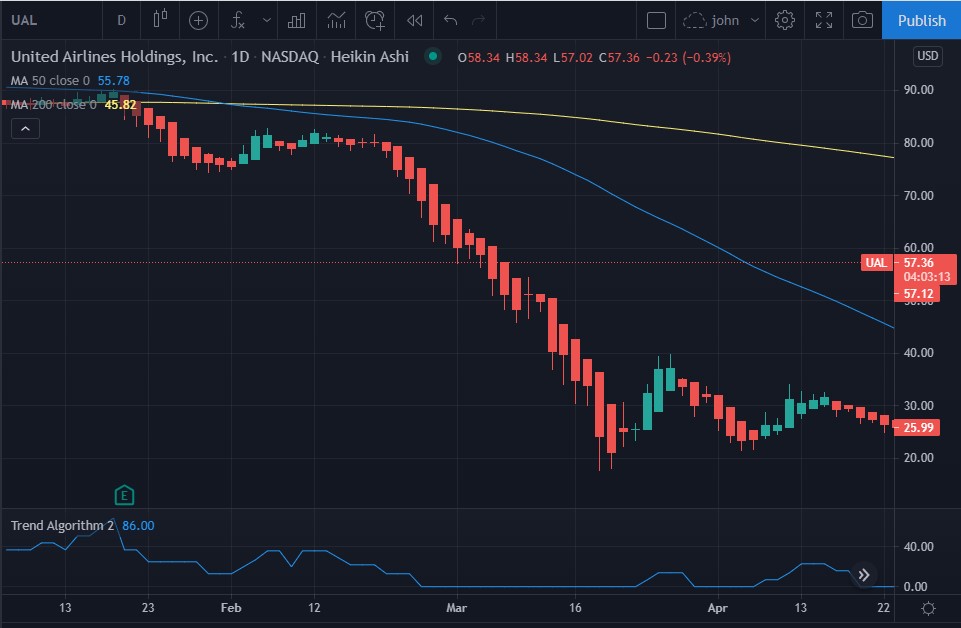
As shown in the highlighted area, the 50-day moving average crossed below the 200-day moving average when United Airlines (UAL) was $75.59. Following the death cross, the price of UAL continued to trend downwards -- all the way down to $20.77 on March 19, 2020. Clearly, the death cross is an accurate signal for a stock’s bearish trend.
Conversely the golden cross is the opposite of the death cross. A golden cross occurs when a stock’s 50-day moving average rises above its 200-day moving average.
Why do stock traders use Death Crosses and Golden Crosses?
Stock traders pay close attention to both gauges because they can help them predict when a stock is going to be bearish or bullish. These indicators facilitate informed decision making on timing to buy or sell. If used correctly, death crosses and golden crosses can be used to one's advantage and lead to significant gains. Of course, there are many other factors to consider as well.
Death Cross Examples
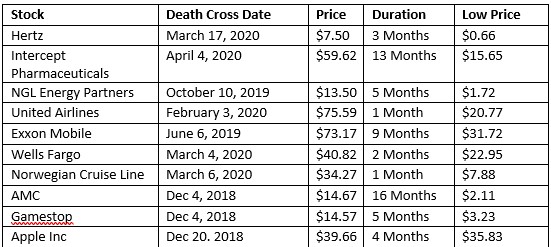
From the list above, you can see why many stock traders follow the golden and death crosses very closely for stocks. Also, many stocks that have death crosses ultimately go into bankruptcy and stop trading. Note the irony that both Gamestop and AMC had their death cross occur on the same day.
When will the 2021 death cross occur for Bitcoin?
Our estimated day of the 2021 Bitcoin death cross is on June 23rd. At the time of this writing on June 9, the 200-day moving average is $41,590 averaging the closing price of Bitcoin from Nov 21 thru June 9. Each day the 200-day moving average is increasing, removing a price between $16,500 to $19,000 and replacing it with the current price of Bitcoin. The 50-day moving average is currently $45,527 calculated from the closing prices of Bitcoin from April 20 thru June 9. Every day the 50-day moving average is decreasing, removing all time high prices between $55,000 to $63,000.
Currently, we estimate June 22 thru 24 as the date range when 50-day moving average will cross below the 200-day moving average.
Who else is waiting for the Bitcoin Death Cross to occur?
Understandably you can see why successful traders want to use analytic tools that have made them significant sums of money in the stock market. However, a critical mistake traders make happens when they apply their proven stock analytical patterns to Bitcoin and other cryptocurrencies.
Crypto Whales also look at stock patterns for Bitcoin, but their purpose is quite different. A Whale’s goal is to force a large group of crypto investors to be liquidated. This was evident during the 2019 Bitcoin Death Cross. Before that death cross occurred, there was an extreme amount of hype and FUD.
What transpired during previous Bitcoin Death Crosses?
A Bitcoin death cross occurred on March 26, 2020 (red arrow in chart below); the Bitcoin price is $6,703. A price increase of almost 50% occurs over the next month and a half when on May 7, Bitcoin was hitting $10,000 price level again. Clearly this 2020 Bitcoin death cross did not cause the price to decline. This Death Cross got little media attention as focus was on the COVID19 pandemic.
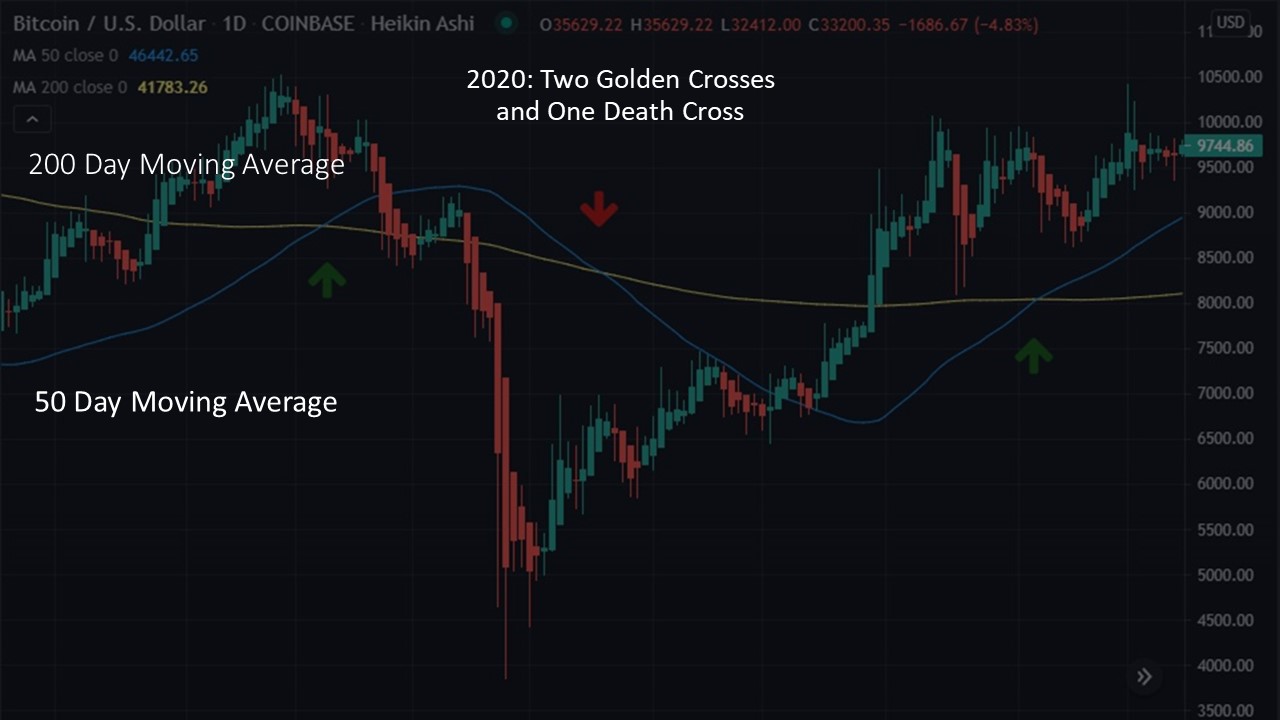
The chart above also includes two golden crosses. The first golden cross (green arrow) occurs on Feb 18 with Bitcoin trading at $9,949; 22 days later Bitcoin dumps below $4,000. This signal is clearly incorrect. The second golden cross occurs May 17, this signal is correct. However, every bullish technical signal was correct after March 12, 2020.
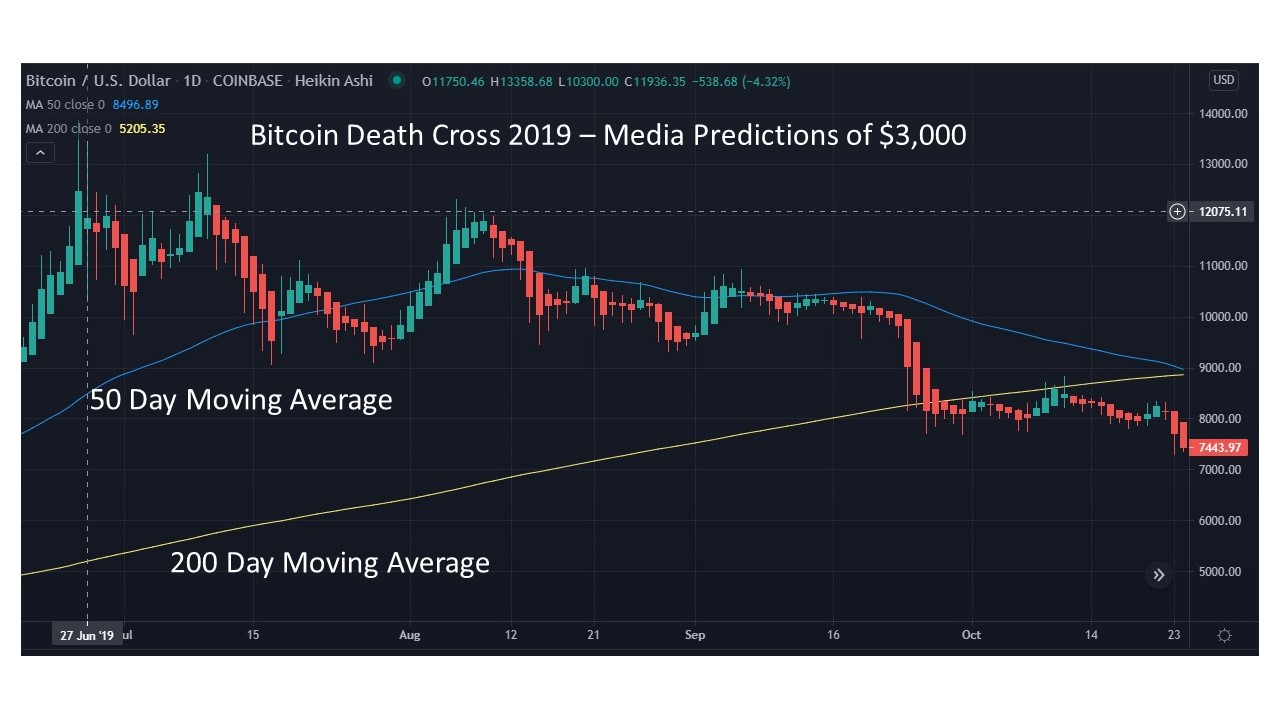
In October 2019, the Bitcoin death cross got a lot of coverage on YouTube and US business channels. Many commentators and experts were explaining how this was the end for Bitcoin. Many memes were generated for this:

The story of the 2019 Bitcoin Death Cross starts on June 26 when the yearly high price of $13,410 occurs. For the next ~4 months the price is in decline until Oct 24 when Bitcoin sinks to $7,443. This decline leads to a very predictable death cross setup.
Bitcoin death cross day arrives on Oct 25. However, there is no price drop to the $3,000 price level many predicted. Instead, Bitcoin’s $3,100 price pumps from $7,443 to over $10,500 in only 12 hours (one of the largest increases at that time). There were many short liquidations that day which fueled the dramatic upward pump.
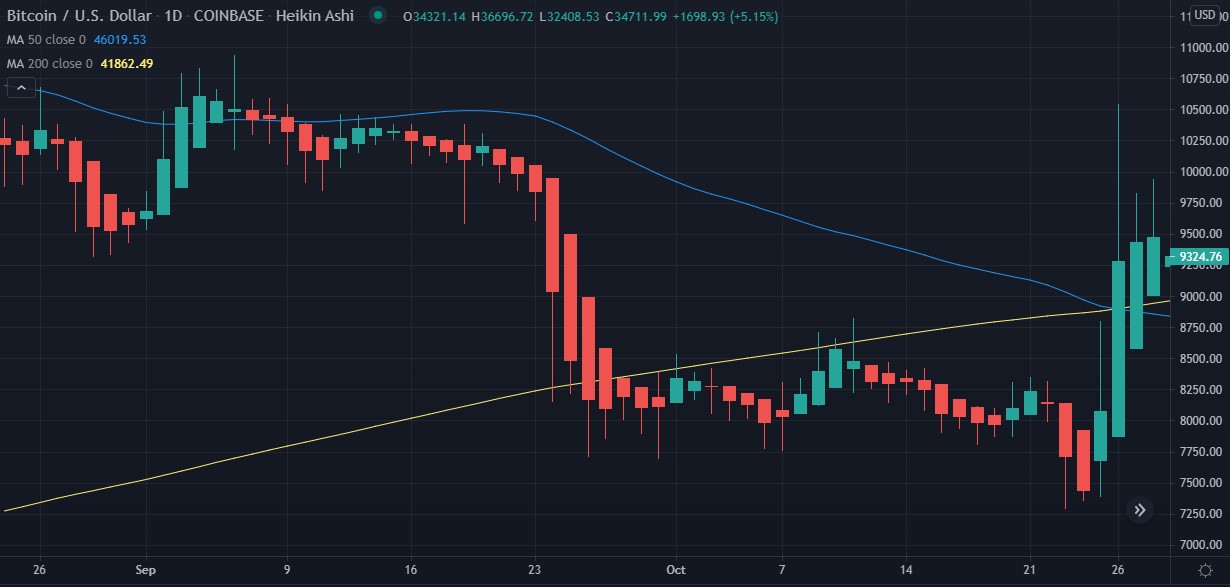
This price action in the chart above (short squeeze) indicates many stock traders were shorting Bitcoin while major buyers (Crypto Whales) pumped Bitcoin price higher. The short squeeze occurs when traders in borrowed and margined positions are forced to close out their short positions. This price spike is short lived as the price will return to the $6,500 price level on Nov 25. Interestingly many experts consider the price decrease to $6,500 as a confirmation that this Bitcoin Death Cross was accurate. If you were shorting Bitcoin on Oct 24, you would have a different opinion.
Predictions of Bitcoin Price Movement
Recently, many Crypto Whales were selling at the market highs in April 2021. Some suspect, without evidence, that there was market manipulation during this recent price decline. It is a safe bet many Crypto Whales have cash on the side ready to pump the market.
In the short term, before June 23, we expect the price pattern for Bitcoin will look very bearish. The testing of the key support of $30,000 is likely to occur. Anticipate a 3-month low price for Bitcoin to occur between June 20 and 23.
Except a large amount of FUD and commentary about the demise of Bitcoin on YouTube, social media and from news outlets. This will be followed by another short squeeze like the 2019 Bitcoin death cross price action, which may lead prices back to the $50,000 level. As always, expect to price action to be very volatile and don’t trade on margin.
The platform Quantify Crypto provides live cryptocurrency prices, technical analysis, news, heatmaps and more. Our flagship product is the trend algorithm, designed to be on the correct side of significant cryptocurrency price moves. We are a new site, please check us out and let us know what you like and do not like about the site.
None of this is meant to be financial advice and we do not have any financial expertise. Although John Barry worked at the New York Stock Exchange for over 23 years, it was as a developer supporting computer systems, not as a stock trader.
Lisa Coppola is an intern working for Quantify Crypto.
Full discloser: John Barry owns Bitcoin and other cryptocurrencies.