Bitcoin Technical Analysis - Dec 6, 2021
John Barry | Tue Dec 07 2021
Bitcoin was trading at $49,220 when I started writing this article. By the time I am publishing it Bitcoin is trading at $50,500. The current Bitcoin price pattern is matching the trading pattern I often see before significant price increases. Reference this link for prior occurrences Prior Trend Patterns
Specifically, these three price pattern conditions have occurred in the past 4 days (referenced in chart):
- A Bitcoin price that has had a significant decline
- Bitcoin price has stopped its decline and has been relatively flat for 12 – 48 hours.
- Seeing a steady increase displayed in the 1 hour candlestick chart.
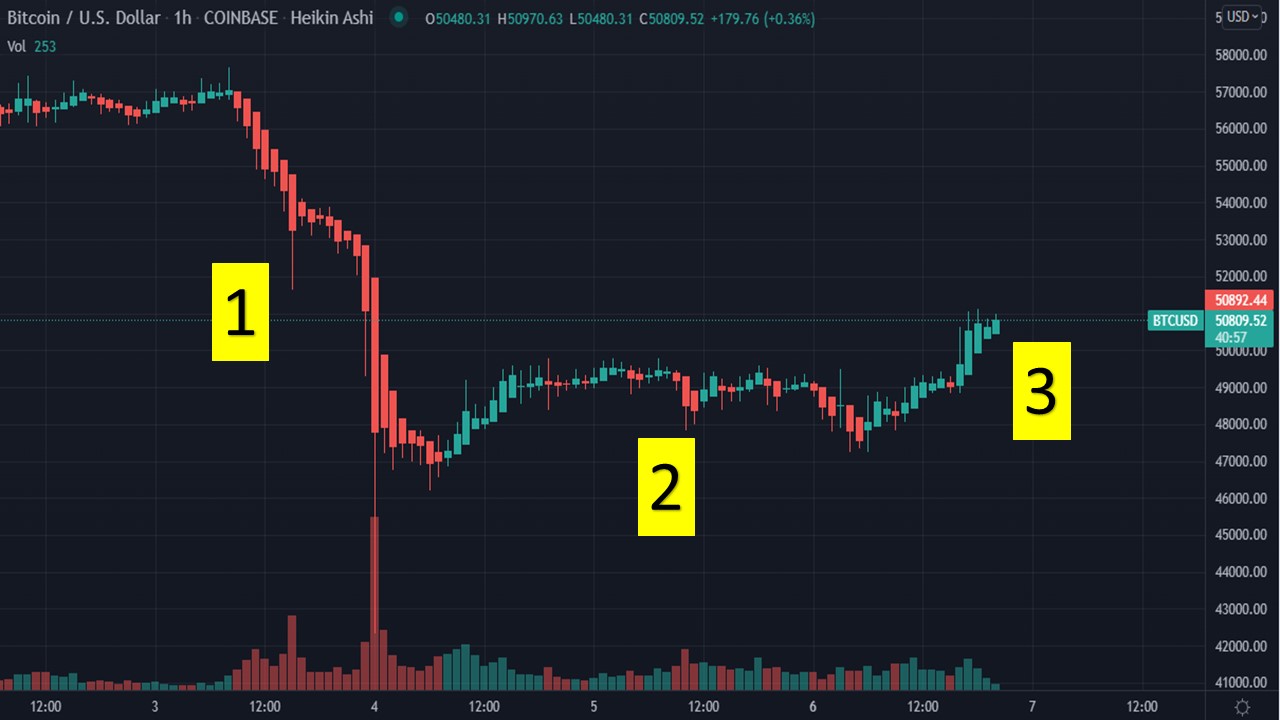
The Setup - Recent Bitcoin Decline
Bitcoin hit an all-time high price over $69,000 on Nov 11th. Since then, it started a decline hitting a low just under $43,000 on Dec 4th. The $43K level lasted less than 5 minutes before extreme buying returned Bitcoin to a price level above $46,000. This was a ~38% decline, and marks the 14th time since Jan 1, 2019 that Bitcoin has lost 20% of its value. It has recovered each time. Here is the link detailing the prior 13 times. https://quantifycrypto.com/blog/bitcoin-bull-run---up-867--with-thirteen-20--dips-since-jan-1--2019-
Current Bitcoin Support Levels
The chart below shows the price range from late September to December 6th. Of note is the $47,000 level as Bitcoin has traded below this level for less than one hour since October 1st , this is a clear support level. The next support level is just below the psychological level of 40K, which was tested multiple times in late July and September.
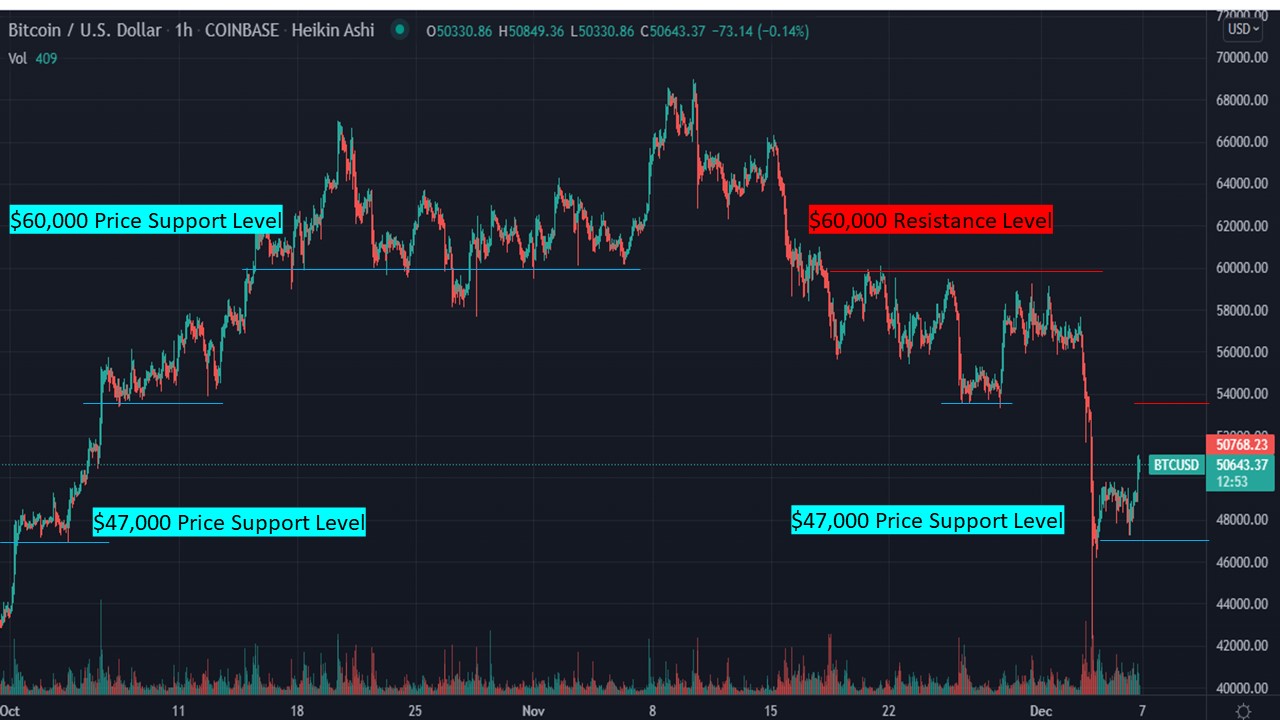
Current Resistance
The above chart also shows resistance levels. Often prior support levels can turn into future resistance levels (and vice versa), this is an excellent example of this. The support level of $60,000 from Oct 16th thru Nov 6th; turned into the resistance level from Nov 17th to Dec 1st. A closer look shows support level of $54,000 occurring from Oct 6th thru 13th; followed again from Nov 26th thru 28th. So, for the short term I see resistance occurring at the $54,000 level.
Applying current Bitcoin metrics to current bullish price patterns.
Short Term RSI metrics signaled Bullish from 5pm to 7pm EST, currently neutral.
Multiple MACD metrics are Bullish (4 out of 7)
Trend indicators are Neutral and Bullish.
Baseline Indicator is Bullish
Bitcoin Technical score is currently Slightly Bullish (71 / 100)
Chart price pattern is Bullish
Quantify Crypto provides real time technical analysis to support your trading decisions. We have the fastest live price feed of all cryptocurrency informational platform. Our proprietary trend algorithm calculates the predicted direction of future price moves. It is specifically tailored for the cryptocurrency market. Our state-of-the-art displays are designed to provide maximum amount of significant data on a single screen.
None of this is meant to be financial advice and I do not have any financial expertise. Although I worked at the New York Stock Exchange for over 23 years, it was as a developer supporting computer systems, not as a stock trader.
Full discloser: I do own Bitcoin and other Altcoins.