Bitcoin Technical Analysis - Sept 10, 2020
John Barry | Thu Sep 10 2020
The goal of this article is to show how I trade using the technical analysis indicators on the QuantifyCrypto.com website and the thought process I am following
The Technical Signals turn Bullish
In my prior article, I indicated I was still waiting for bullish signals before buying back in and listed 3 criteria items. All 3 of these did turn positive on Sept 9 so I did put my reserves fully in.
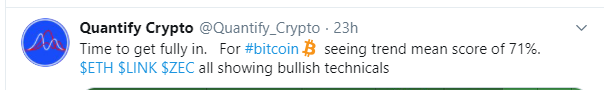
This was my tweet
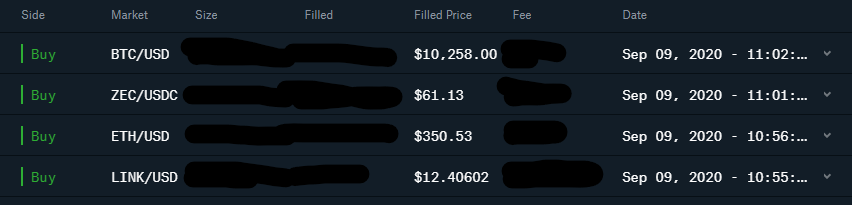
The Technical Plan Excuted
To recap from my prior article, access the blog at https://quantifycrypto.com/blog
The Technical Analysis Indicators I am waiting for (before I buy more):
- The Trend Mean score to be 70% or greater for Bitcoin and the Altcoins I am interested in purchasing. Trend Mean score reaches 70% for Bitcoin and other altcoins This occurs at 11:00 am est on Sept 9th
- I need at least 2, preferably 3 of these 4 indicators to be Bullish
- Current Price is trading above the baseline - This is Positive at 11:00 am on Sept 9th
- The MACD is positive for the majority of these timeframes: 15 Minute, 30 Minute, 1 Hour and 2 Hour - Positive at 11:00 am on Sept 9th
- The 5 minute and 15 minute RSI values are above 70% - Neutral, but in high 60s (close)
- The Bollinger Bands Indicate a breakout (Price is trading “Above” the upper BB) Bitcoin is near the upper bands, Ethereum is above the upper bands.
- Global Markets cannot be ignored - Want to see the stock market and gold market stable or going up. US Stocks open strongly on Sept 9th, and continue higher as the trading day proceeds.
This was the criteria I had, before buying back in.
My Current Techncial Plan:
- My key concern is how global markets are going to perform. If the stock market can stay stable (or go up) this is a plus for the crypto market in my opinion.
- After hitting a trend mean score of 71%, it dipped down to 56% for Bitcoin, before rebounding to a current score of 81%. The other 3 altcoins I purchased also have neutral ratings. I will continue to hold as long as the trend mean score is above 30%.
- Secondary indicators continue to be bullish, MACD 1 hour and Baseline. RSI and Bollinger Bands are neutral.
In Summary, I am currently in a holding pattern and will think about selling when item #1 and/or #2 above occurs.
Cryptocurrency Market Performance in the past 24 hours
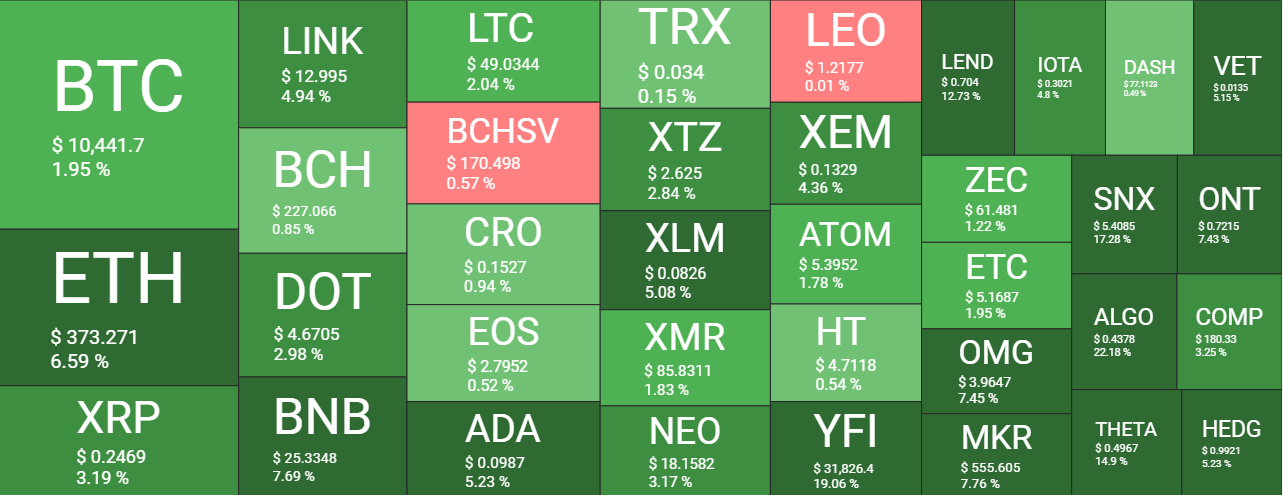
The platform Quantify Crypto provides live cryptocurrency prices, technical analysis, news, heatmaps and more. Our flagship product is the trend algorithm, designed to be on the correct side of significant cryptocurrency price moves. We are a new site, please check us out and let us know what you like and do not like about the site.
None of this is meant to be financial advice and I do not have any financial expertise. Although I worked at the New York Stock Exchange for over 23 years, it was as a developer supporting computer systems, not as a stock trader.
Full discloser: I do own Bitcoin, Ethereum, ChainLink, ZCash and have stock positions.