Bitcoin Technical Analysis - Waiting for a Bullish Signal
John Barry | Tue Sep 08 2020
Last week I wrote about my technical analysis indicators turning negative and selling. I thought I was fortunate to get out when Bitcoin had a price of $11,900 and it had dropped to $11,400. I also wrote in the article I would be looking to buy back in, but would wait longer if the price dropped below the support level of $11,200.
The terrible performance that occurred was greater than I and most thought it would be.
7 Day Cryptocurrency Performance
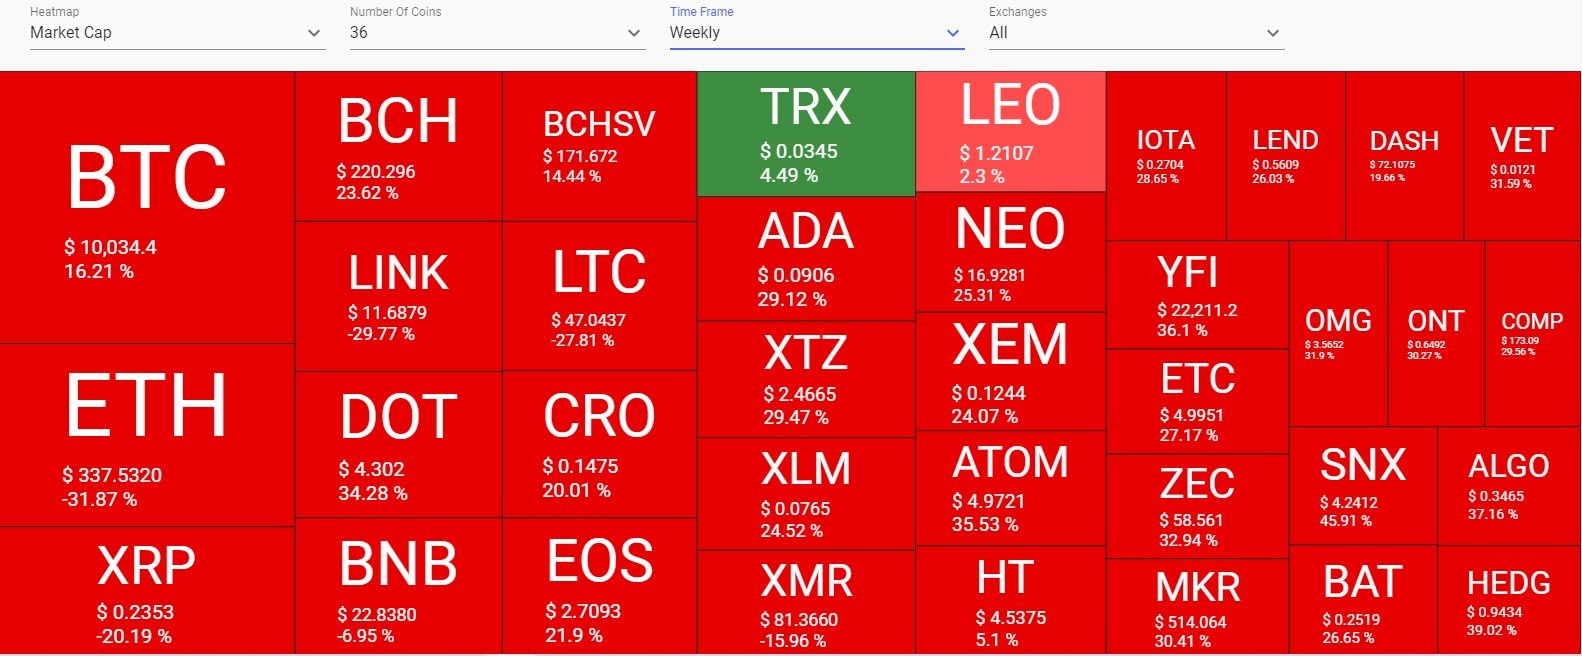
Out of the leading 36 Cryptocurrencies only 1 is currently up for the past 7 days, Tron is up over 10% today allowing it to have a weekly gain. Bitcoin is down 16%.
Notable decliners for the past 7 days: Synthetic Network Token -45%; Yearn.finance -38%; HedgeTrade -38%; Algorand -37%; PolkaDot - 35%; Cosmos - 34%; Ethereum -31%; VeChain -30%; Maker -30%; Tezos -30%; Chainlink -29%
I was eager to buy the dip and the technical analysis indicators were just neutral. So I did commit 50% of my funds to buying at significantly lower prices. Here our my purchases:
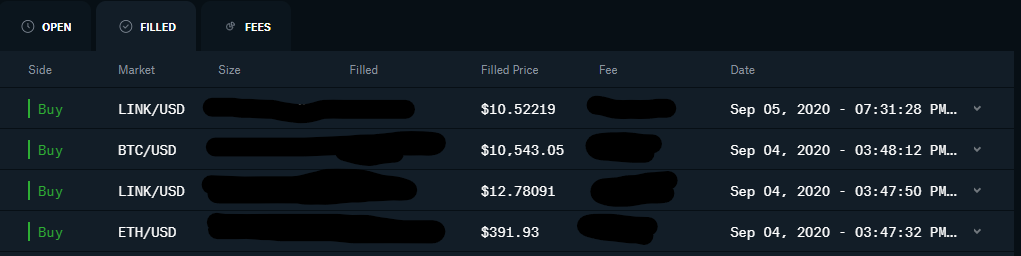
While my buy prices are high compared to today’s prices, I always want some of my funds in crypto, additionally since I did sell high I did not need to buy at the lowest price.
The Technical Analysis Indicators I am waiting for (before I buy more):
- The Trend Mean score to be 70% or greater for Bitcoin and the Altcoins I am interested in purchasing
- I need at least 2, preferably 3 of these 4 indicators to be Bullish
- Current Price is trading above the baseline
- The MACD is positive for the majority of these timeframes: 15 Minute, 30 Minute, 1 Hour and 2 Hour
- The 5 minute and 15 minute RSI values are above 70%
- The Bollinger Bands Indicate a breakout (Price is trading “Above” the upper BB)
- Global Markets cannot be ignored - Want to see the stock market and gold market stable or going up
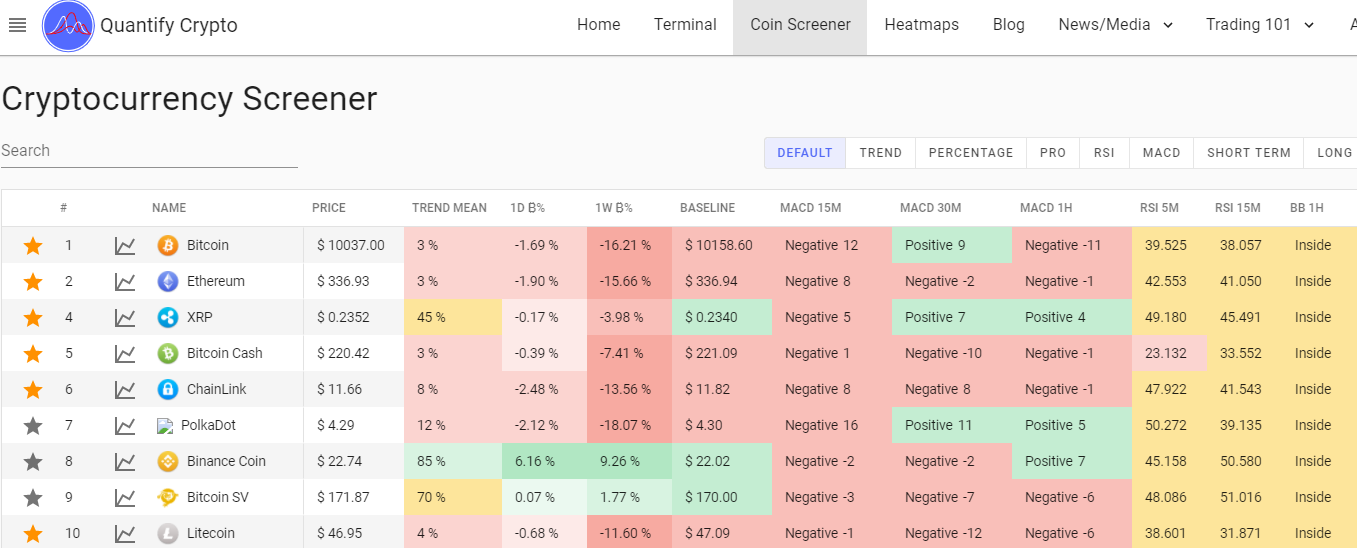
Current Technical Analysis
- Current trend mean score for Bitcoin is 1%, clear indication I am staying out it has a long ways to go before it proves the price is stable.
- These values do not matter now, since trend mean is under 70% (they are mostly bearish anyway)
- Global Markets Suck right now, caution is needed.
Since the current stock market reminds me so much of 1987 (Yes I am dating myself), I still remember how big losses in mid August thru mid October led to Black Monday on October 19th of that year. I have a definite fear factor about buying more right now. I will buy if the Technical Analysis indicators turn positive, I will continue to hold 20% cash on the side for my cryptocurrency assets no matter what happens until November.
The platform Quantify Crypto provides live cryptocurrency prices, technical analysis, news, heatmaps and more. Our flagship product is the trend algorithm, designed to be on the correct side of significant cryptocurrency price moves. We are a new site, please check us out and let us know what you like and do not like about the site.
None of this is meant to be financial advice and I do not have any financial expertise. Although I worked at the New York Stock Exchange for over 23 years, it was as a developer supporting computer systems, not as a stock trader.
Full discloser: I do own Bitcoin and have stock positions.