Quantify Crypto Signals - Support and Resistance
John Barry | Tue Apr 26 2022
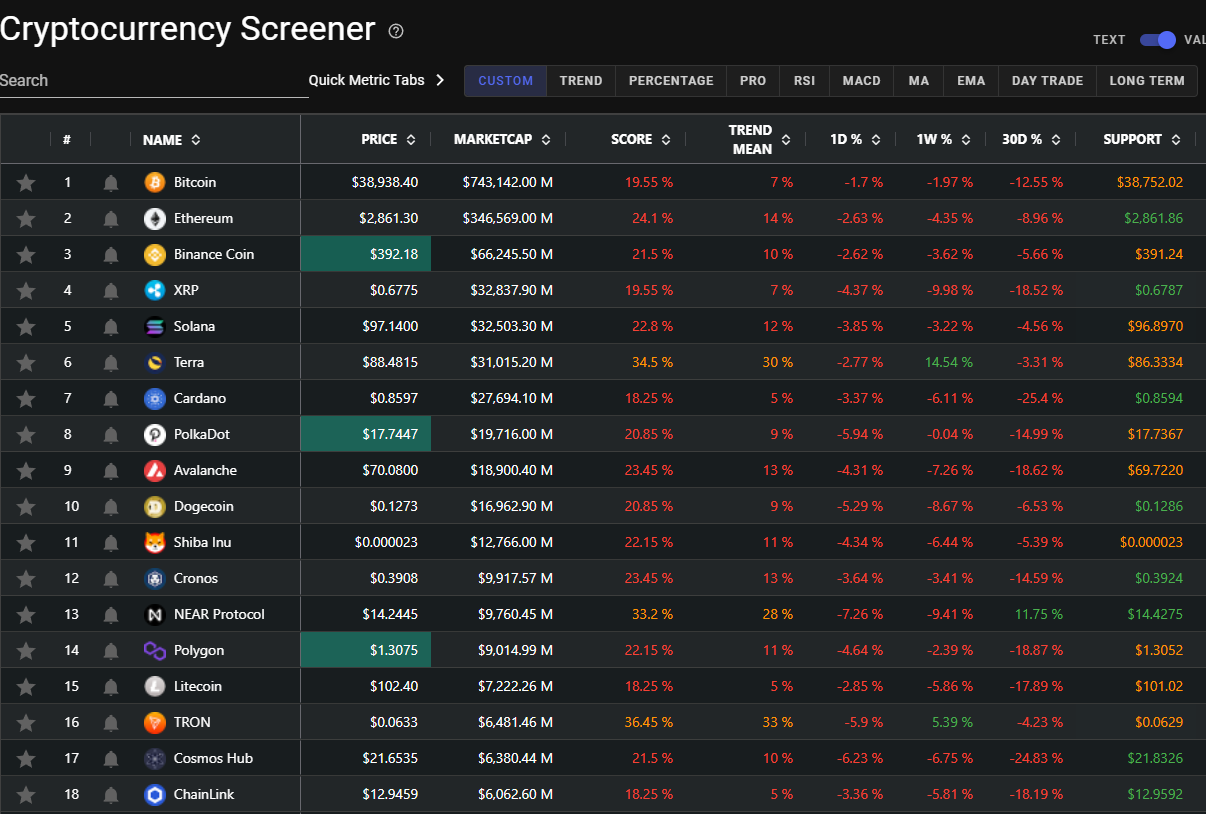
Support Crypto Signal Triggers on April 24
On April 17th Quantify Crypto added Support and Resistance metrics to the Coin Screener page, these have proven to be very accurate. The Support level identifies the bottom price point for a specific cryptocurrency based on its recent trading history. On Sunday April 24th Bitcoin and most of the Altcoins were dumping. This was the first time multiple cryptocurrencies were triggering the new Support price level on the Quantify Crypto Coin screener (indicator green for buy low). Here’s the snapshot from April 24th at 9:00 pm (EST).
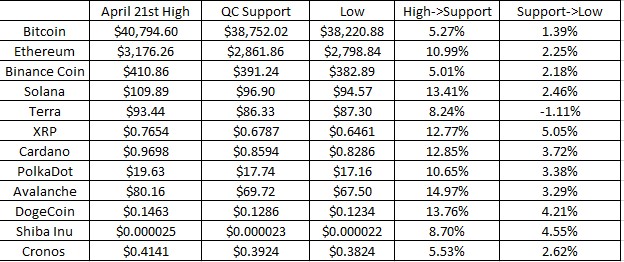
Of the top 12 trading cryptocurrencies, 11 of them would hit and trade below the support level for a short period of time. This is an example of using technical analysis to determine where the bottom of a price movement may occur. The chart below shows the percentage change from a short-term high price from April 21st to the support levels that triggered on April 24th. Most of the cryptocurrencies would continue to go down after the support levels hit; however, the larger price decline occurred before the support levels are reached.
Twitter Board approval of Elon’s Musk purchase leads to April 25th Price Rebound
All the top cryptocurrencies would have a strong rebound on April 25th due to the news the Twitter Board of Directors approved the Elon Musk purchase. Dogecoin led the upwards charge going up 37% from the low prices on April 24th. All of the other top cryptocurrencies were up 5.5 to 13.6 percent, not bad for a single day.
Quantify Crypto Technical Support Calculation
Quantify Crypto uses a modified Keltner Channel (KC) calculation for support level calculation. Normally, a 10-day moving average is applied to the daily Average True Range (ATR) to determine the KC support level. Quantify Crypto is applying the 21-hour moving average to the daily ATR to determine cryptocurrency KC support level. Our support calculation is from our research of higher volatility crypto price movements compared to traditional assets. The original KC calculation is designed and used for lower volitionally Stock and FX price moves.
When the price moves to the support level it represents an oversold condition. Many will view this as a price entry opportunity with the expectation the price will recover back to an expected trading range. This feeds nicely into the “buy low, sell high” trading philosophy. Quantify Crypto knows it is best to verify that the price has stopped its downward trend and has shown price stability or recovery before entering a new position.
The key concern when the support level occurs, is whether the supply of buy orders is enough to pause the negative trend. If the price decline continues at this level, it can be very significant. Often a support level will fail when there is significant news influencing the specific cryptocurrency or the overall crypto market.
Reference Links
Coin Screener - https://quantifycrypto.com/coin-screener
Signals - https://quantifycrypto.com/signals
Support and Resistance (scroll down) - https://quantifycrypto.com/info/trading-tips
Quantify Crypto provides real time technical analysis to support your trading decisions. We have the fastest live price feed of all cryptocurrency informational platform. Our proprietary trend algorithm calculates the predicted direction of future price moves. It is specifically tailored for the cryptocurrency market. Our state-of-the-art displays are designed to provide maximum amount of significant data on a single screen.
None of this is meant to be financial advice and I do not have any financial expertise. Although I worked at the New York Stock Exchange for over 23 years, it was as a developer supporting computer systems, not as a stock trader.
Full discloser: I do own Bitcoin and other Altcoins.