The Critical Candle to follow for Bitcoin
John Barry | Tue Aug 11 2020
I often talk about the importance of short time periods for cryptocurrency. I view the 1 hour candlesticks as the most important time period to track. For example the Bitcoin trend has clearly been bearish since the $11,900 level.
After hitting a peak at ~12,090 it sufferred a dramic dip to ~11,465 and had a nice bounce back to $11,983. Since then nothing good has happen to the price action, nothing but a steady decline.
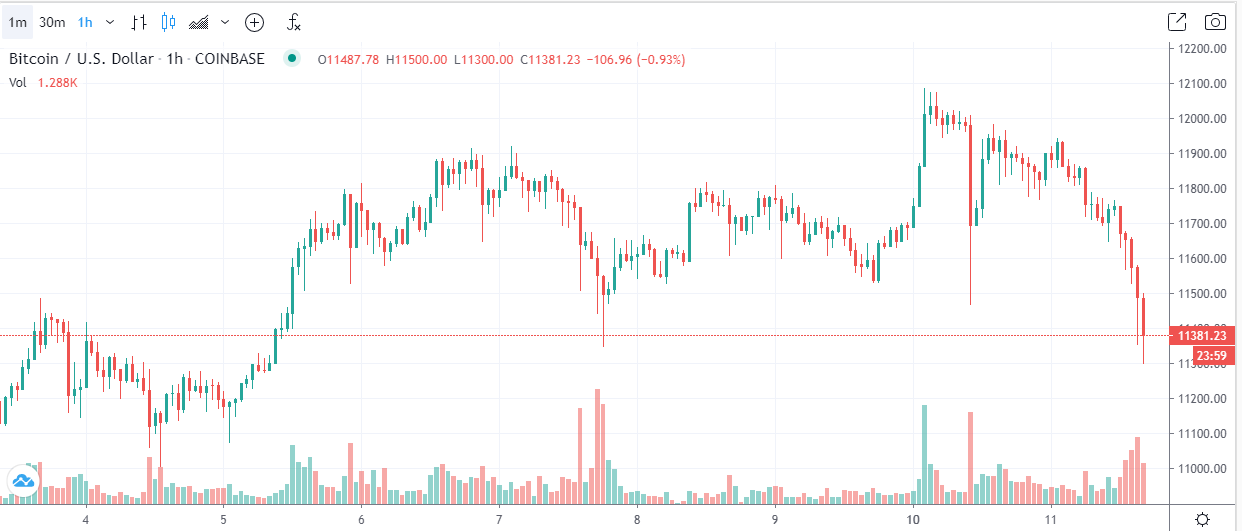
The Quantify Crypto Trend algorithm is negative due to this movement, also bearish are price failures at the Bollinger Bands support levels and the MACD is negative.
You have been warned. I do plan to buy the dip the best possible way by not being in the dip.
The platform Quantify Crypto provides live cryptocurrency prices, technical analysis, news, heatmaps and more. Our flagship product is the trend algorithm, designed to be on the correct side of significant cryptocurrency price moves.
We are a new site, please check us out and let us know what you like and do not like about the site. None of this is meant to be financial advice and I do not have any financial expertise. Although I worked at the New York Stock Exchange for over 23 years, it was as a developer supporting computer systems, not as a stock trader.
Full discloser: I do own Bitcoin and have stock positions.