Using Technical Analysis to Improve you Cryptocurrency Trading Results (Sept 23 - Oct 1)
John Barry | Thu Oct 01 2020
Today I want to focus on technical support levels and why they are important. I will explain later in the article the technical indicator I used to get out of my trades with profits. To start I want to review my buys on Sept 23rd and 24th.
On Sept 23rd and 24th the technical indicators on our website identified buying conditions for ChainLink, Ethereum and ZCASH. I will briefly review ZCASH in this article, for more details on my buying philosophy you can reference this link https://quantifycrypto.com/blog/a-momentum-indicator-to-improve-your-cryptocurrency-trading
To start here are the buy orders I made on the 9/23 and 9/24.
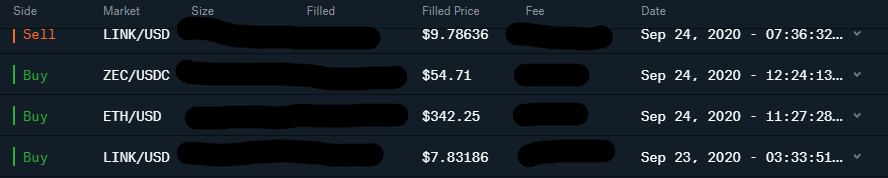
Yes, I would sell half of my ChainLink purchase the next day. I had a profit and wanted to lock in some gains.
Here is the ZCASH chart:
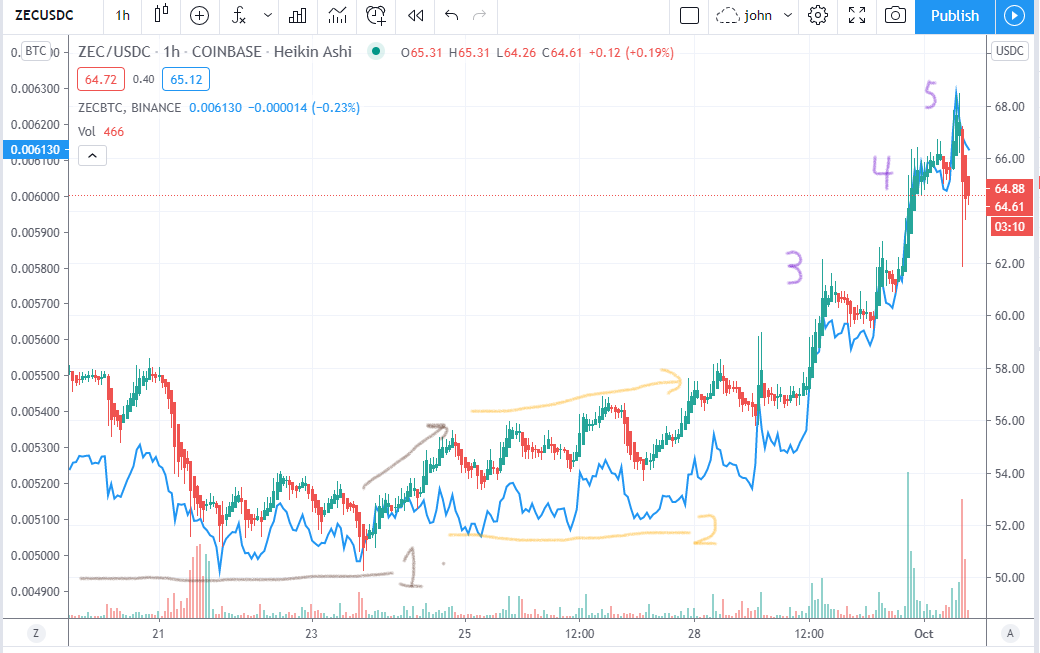
Technical Analysis Sequence
At the time of my purchase (1) I am thinking the following
- ZCASH has rebounded off of the support levels of .00495 BTC (or ~$51.00 USD). Note Blue Line is ZEC/BTC
- The Trend Mean scores on QuantifyCrypto.com are over 80%
I continue to hold ZCASH (2) I am thinking:
- I do not have profits yet
- Support is holding at .00505 BTC
- Trend Mean score is neutral (not bearish)
Breakout start to happen for ZCASH (3,4,5) I am thinking:
- I want to secure profits
- This can still ride higher as ZCASH is outperforming Bitcoin, while Bitcoin is outperforming the US dollar and other FIAT currencies.
- I set my price alerts to trigger if the price of ZCASH falls below the Baseline (now support level). I do this for all my Cryptocurrency positions
At 11:50 on Oct 1st my automated alerts start to trigger (we are in our Beta version, excuse the spelling error)
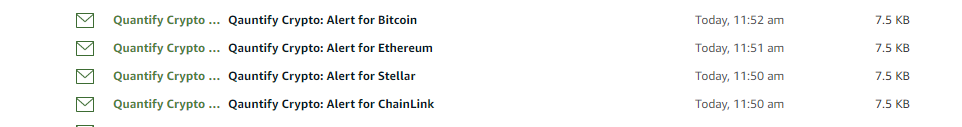
When the market starts falling, check Bitcoin
While the alert for ZCASH will come minutes later (since it's still higher than its baseline) it is clear a market event has occurred. My first question: is this a short term price event to be followed by an immediate bounce back OR is this a trend changing occurrence? Time to look at the Bitcoin Chart, when a significant event is occurring look at Bitcoin as the altcoins will follow how BTC moves.
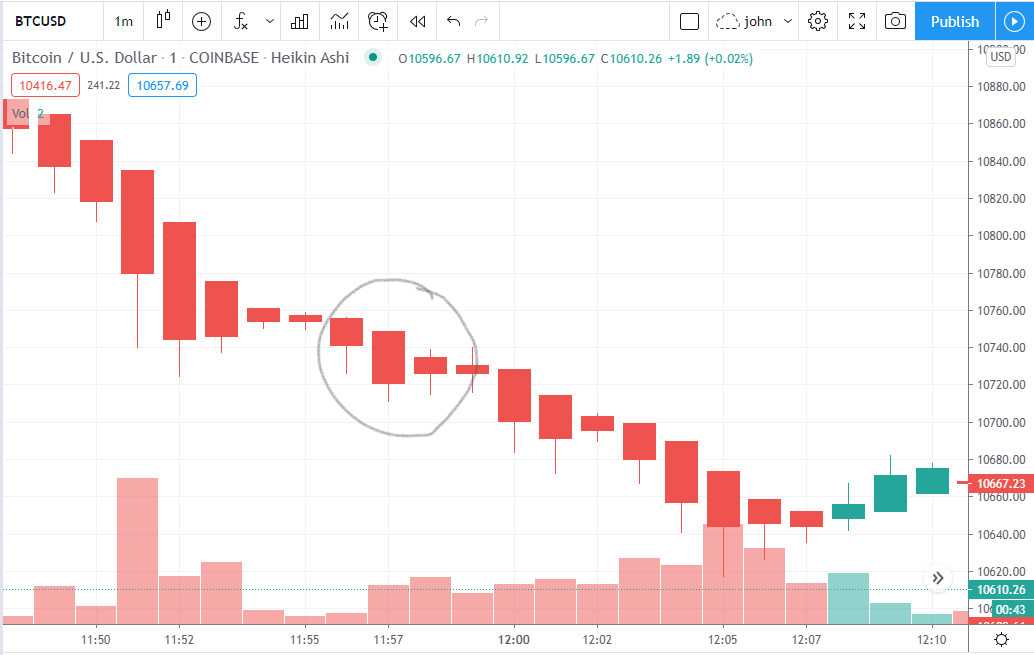
I start watching the Bitcoin chart at ~11:54, after watching for another 3 minutes, I am not seeing signs of a bounce back. There have been over 10 downward candlesticks in a row, the lows at 11:57 are lower than the prices at 11:52. It is time to sell as the trend is clearly changing.
Here are my sells
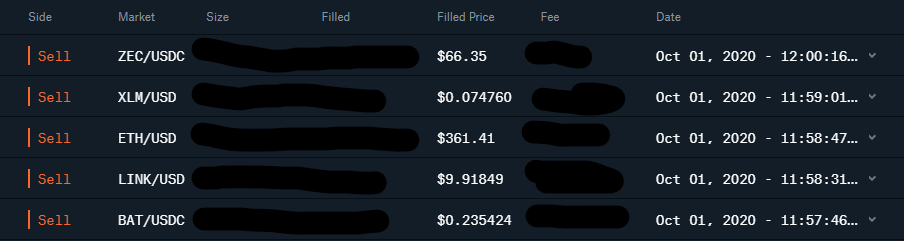
Later I will learn the dump is due to a news event that the US government has arrest warrants for the founders (and others) of the BitMex exchange. Often you see the price changes for cryptocurrency before learning of the reason for the price move. This this case I sold based on price movement going below technical support levels, I was not aware of the BitMex story when I was selling.
To review, I used the Quantify Crypto bullish trend signals to entry into my positions. After profit levels have been reached I used the Quantify Crypto baseline values for my support. After support is broken for multiple cryptocurrencies I sold out.
Next Steps
Since my technical analysis allowed me to miss this downturn, I have the benefit of waiting for a price dip. I will start to phase in some buys as I feel this is a news event that will not have a long term impact of the price of Bitcoin and other altcoins.
I will hold on to at least 50% of my funds and wait for a bullish trend to re-establish itself before I buy back in. Specifically I want to see altcoin trend mean scores of 70% and higher while Bitcoin is bullish or neutral.
The platform Quantify Crypto provides live cryptocurrency prices, technical analysis, news, heatmaps and more. Our flagship product is the trend algorithm, designed to be on the correct side of significant cryptocurrency price moves.
We are a new site, please check us out and let us know what you like and do not like about the site.
None of this is meant to be financial advice and I do not have any financial expertise. Although I worked at the New York Stock Exchange for over 23 years, it was as a developer supporting computer systems, not as a stock trader.
Full discloser: I do own Bitcoin and have stock positions.