What is the Quantify Crypto Trend Algorithm?

John Barry | Wed Dec 07 2022


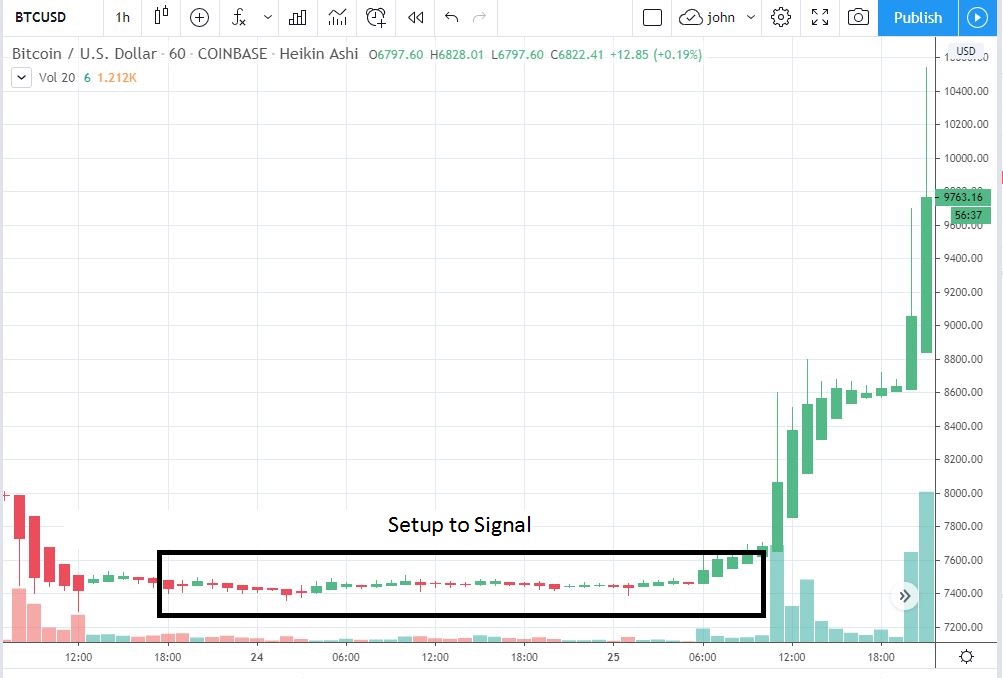
The Quantify Crypto (QC) Trend algorithm is a momentum indicator designed to predict future cryptocurrency price movements. It identifies bearish (exit) or bullish (entry) conditions of a coin, and scores them from 0-100. The QC Trend aims to ensure that asset positions are on the correct side of significant price movements. Our research and back testing indicates that significant price movements are often preceded by smaller price moves in the same direction, a trend that the QC Trend algorithm is designed to detect.

Trend Algorithm Values

Signal Description
Bearish (0-30) Values below 30 indicate downward price movement is likely to occur. This signal is strongest when it first occurs. As the value gets lower, it is confirmation of the downward price movement.
Neutral (31-69) Indicates the price movement has paused from its upward or downward trend. Importantly, a neutral signal does not mean the ending of the previous Bullish or Bearish signal. The neutral condition is not an exit condition.
Bullish (70-100) Values 70 and above indicates upward price movement is likely to continue. This signal is strongest when it first occurs. As the value gets higher it is confirmation of the upward price movement.


Coinbase Institutional Trading Impact on Crypto Price Trends

For years Coinbase has been providing cryptocurrency trading services for institutional clients. Coinbase has disclosed that they use “Advanced algorithms designed to minimize market impact”. Specifically, they take a large client order and create thousands of smaller orders to execute on multiple cryptocurrencies exchanges. Coinbase will execute these orders periodically over an expanded time range.
 
This trading pattern is designed to provide Coinbase clients with the best price execution. Thus, when executing a multimillion-dollar position, it can result in a slower price movement rather than a price spike or dump. This can limit impact this has is the removal of liquidity on the other side of the Coinbase position (are you trying to point out that this will not lead to more selling or buying given the gradual change in proces). A lack a liquidity can and does often lead to higher volatility with larger price swings.
 
The Coinbase trading algorithm further supports Quantify Crypto's thesis that large cryptocurrency price moves are often proceeded by smaller price moves in the same direction. Furthermore, in addition to Coinbase, many other institutions often try to mask their intent by using multiple accounts and exchanges.
 

Basic Concepts of Trend

A successful trend model needs to quickly detect price changes yet be robust enough to avoid false signals. Prices movements are made up of peaks and troughs. Trend analysis compares the direction of multiple price points to determine if the price movement is moving up, down, or sideways. Detecting a price direction change, or trend reversal, will lead to a new trend indication.
 
Several technical metrics that are used to determine trends include: QC Trend algorithm, Moving Average Convergence Divergence (MACD), Moving Averages (MA), and the Exponential Moving Average (EMA).

Trend Lengths

If you ask 10 different technical analysts what they believe to be the best trend duration to use, you most likely will get 10 different answers. However, most will agree that longer time frames, which incorporate more data are more significant given that its helps to reduce the standard deviation from the mean. Importantly, recent data is the most accurate representation of current price movement. A quality trend indicator needs to incorporate both long-term and short-term time periods.
 
Volatility plays a critical role in defining the ideal trend length to follow. Long-term trend periods are best for assets with low volatility, while short-trend periods are best for assets with high volatility. Since Cryptocurrencies are more volatile than equities, exponential moving averages (EMA) provide a better indicator than moving averages (MA) which tend to have more of a lag in detecting a change in trend.
 

The EMA Signal Advantage

The Exponential Moving Average (EMA) is like the Moving Average (MA) with one important improvement. The MA is an average calculation giving equal weight to each time period. The EMA calculation assigns higher weights to the most recent time periods when calculating the average. Hence, many technical analysts prefer EMA to MA given it tends responds more quickly to recent price trends. In short, MA lags too much compared to the EMA.
 
A bullish signal is when the shorter time period EMA has a greater value than the longer term period; a bearish signals can occur when the EMA for a short time period is less than the EMA for the longer time period. For example, a bullish signal occurs if the 1-hour EMA price for Bitcoin is $25,445 while the 4-hour EMA price is $25,285 (the 1-hour EMA > 4-hour EMA).
 
Many times algorithmic indicators utilize EMA time comparisons as a building block for their analysis. For example, the MACD and the QC Trend algorithmic values are both based on specific EMA calculations and comparisons.
 

Quantify Crypto Trend Time Frames

Name Candlestick (minutes) Total time in Hours Total time in Days
Spot 5 41.6 1.75
Short 15 125 5.2
Medium 30 250 10.4
Critical 60 500 20.8
Long 120 1,000 41.7
Mean Average of above 1,000 41.7


To give an example, the “Short” QC Trend algorithm uses 15-minute candlesticks. When using a three period EMA, it would calculate using the trading history of the most recent 45 minutes, performing a calculation based on three 15-minute time periods. The same three period EMA calculation using the “Critical” QC Trend algorithm would use the three most recent one-hour time periods.  Each QC Trend algorithm using multiple EMA crossovers periods.   The "Short" QC Trend algorithm, has a historic look back period 125 hours when processing the past 11 EMA comparison price points.
 
The trend mean score uses a weighted average of the 5 trend time periods in the chart.

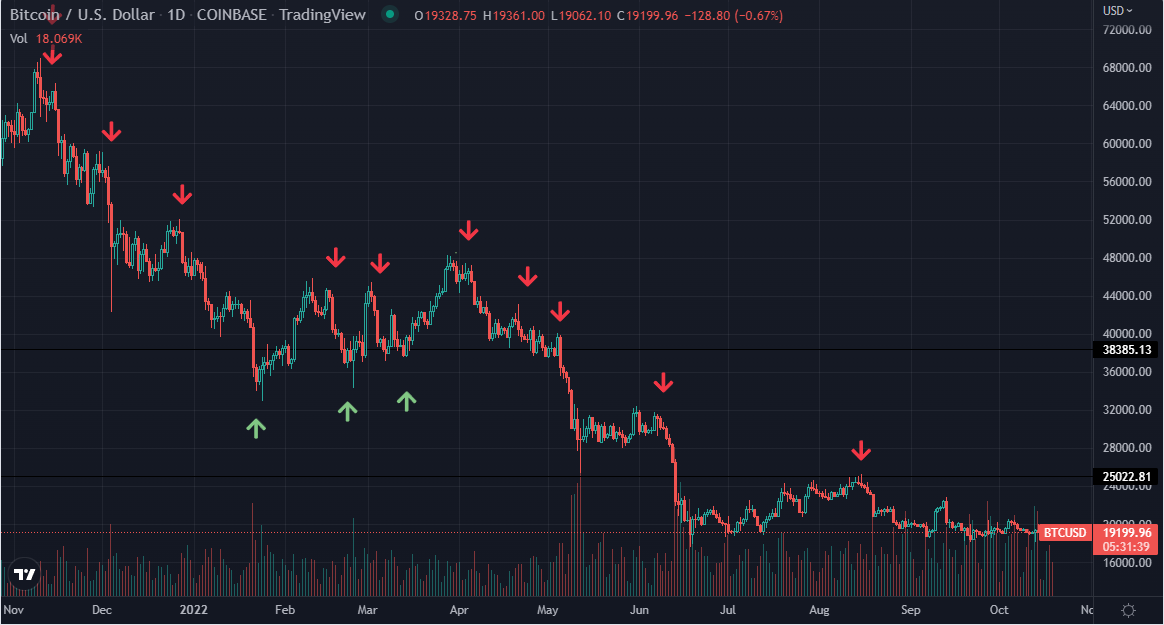
Bitcoin Trends in 2022

 In 2022, price trends in the cryptocurrency market continue to be an important indicator of the future direction. The largest price movements in Bitcoin in 2022 were preceded by smaller price moves in the same direction. The arrows in the chart below show these occurrences. The chart is the daily BTC/USD price from Nov 2021 to Oct 2022. Most altcoins have followed a similar pricing trend as Bitcoin.

2022 Bitcoin Chart with bullish and bearish trend signals
Daily BTC/USD Chart - Trading View

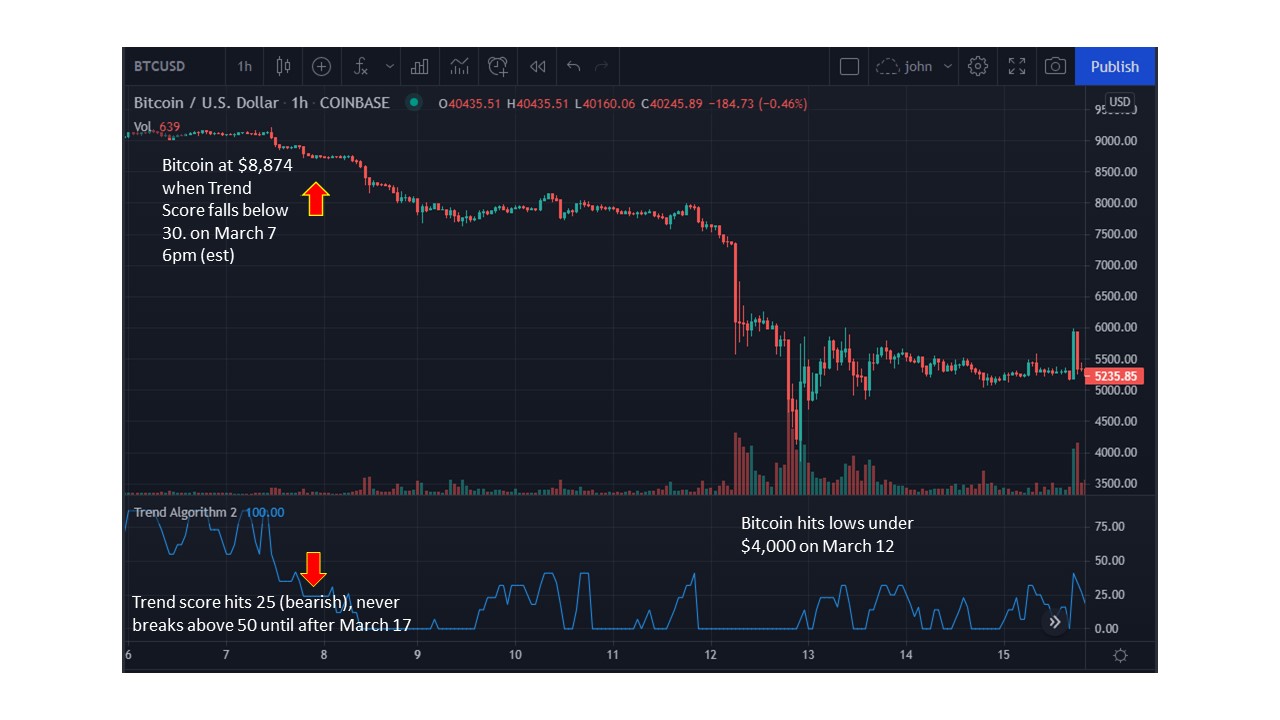
These price patterns match prior patterns, the linked document reviews 14 significant prices moves from March 2019 to March 2020.  Historical Quantify Crypto Trends for Bitcoin


Bitcoin Price Dump Example

Did you heard this statement: “Without warning Bitcoin just dumped”? These are words spoken by traders and analysts when looking at Bitcoin's daily price chart candlesticks on March 12, 2022. Our research indicates that using hourly price chart candlesticks can be exceptionally valuable when conducting Bitcoin price analysis. This is clearly illustrated on the next chart. The hourly chart was already showing a clear downward trend for Bitcoin.
 
Bitcoin Price Drop - March 12, 2020
BTC/USD Hourly Price Chart - March 2020 - Trading View
 
This is the BTC/USD price chart from Mar7th thru 12th with 1-hour candlesticks. The QC Trend algorithm turned bearish based on the price movement, from a price of ~$9,200 to $8,800. This decrease would prove to be just a small percentage of the upcoming price drop to $3,978. The heavy volume and lack of liquidity caused the Bitmex exchange to go down during the price dump. This is a clear example of a liquidity crash. The Bitcoin price rebounds 15 minutes later to $5,743 when liquidity was restored.

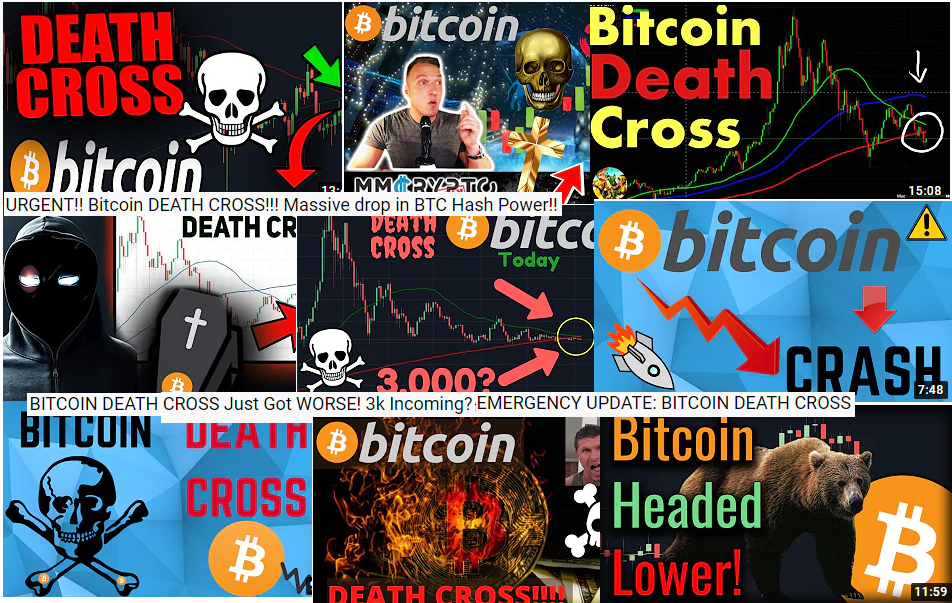
Bitcoin Death Cross 2019 - Predictions

The death cross is a technical chart pattern that indicates a bearish trend for a stock. The death cross occurs when a stock’s 50-day moving average falls below its 200-day moving average. On a price chart, you can see the death cross when the 50-day and 200-day moving average lines connect. This indicator has been very successful for stocks, however cryptocurrencies trade with a much higher volatility than stocks, research and results show long daily moving averages lag too much for predicting crypto currency price movement.
 
In October 2019, the Bitcoin death cross got a lot of coverage on YouTube and US business channels. Many commentators and experts were explaining how this was the end for Bitcoin. Many memes were generated for this.
 
Images from YouTube of 2019 Bitcoin Death Cross Coverage


Bitcoin Death Cross 2019 - Setup

The story of the 2019 Bitcoin Death Cross starts on June 26 when the yearly high price of $13,410 occurs. For the next ~4 months the price is in decline until Oct 24 when Bitcoin sinks to $7,443. This decline leads to a very predictable death cross setup.
 
The daily price chart shows the 50 day moving average is ready to fall below the 200 day moving average. Many stock traders have entered into short positions for Bitcoin as they have successfully made profits by following this strategy in the stock market.
 
However Crypto whales have also been watching Bitcoin price movements and have a different plan. Meanwhile the QC Trend algorithm is flashing a bullish trend.
Setup of Bitcoin Death Cross
Daily BTC/USD Price Chart - Trading View


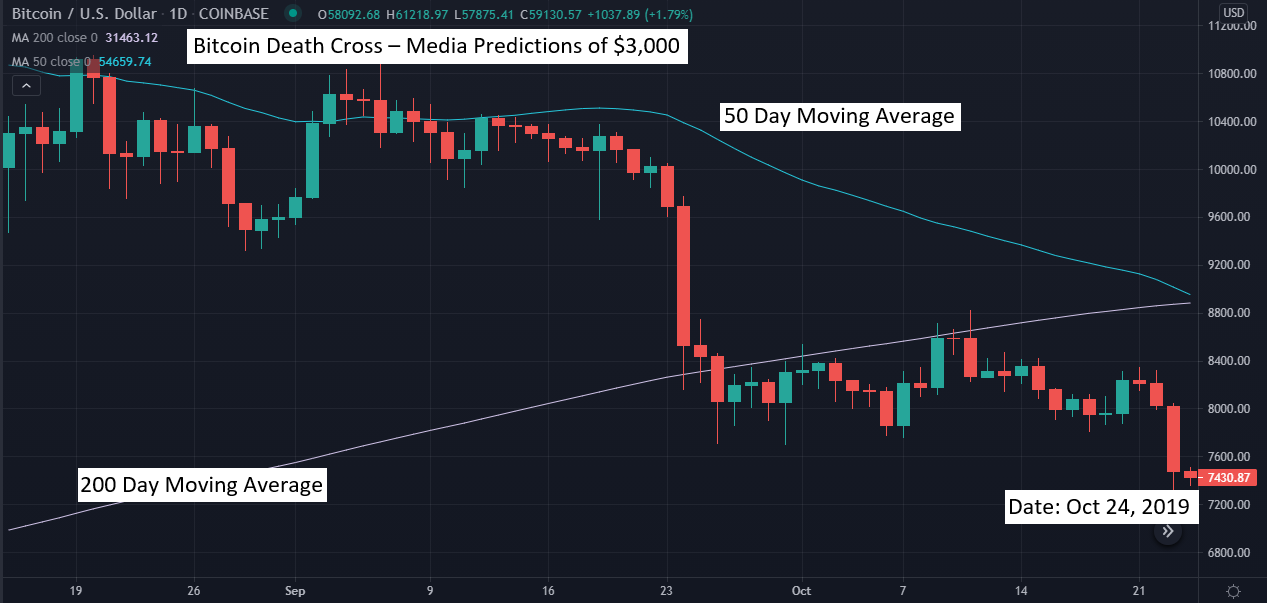
Bitcoin Death Cross - Result

Bitcoin death cross day arrives on Oct 25, 2019. However, there is no price drop to the $3,000 price level many predicted. Instead, Bitcoin’s price pumps from $7,443 to over $10,500 in only 12 hours (one of the largest increases at that time). There were many short liquidations that day which fueled the dramatic upward pump.
Bitcoin upwards price surge on Bitcoin death cross day
Hourly BTC/USD Price Chart - Oct 24 and 25, 2019 - Trading View
This is an example of a liquidity shortage causing a price spike. As many traders were in leveraged positions expecting a price decrease, and they are forced to close these positions as they get margin called.


Conclusions

  • Cryptocurrency trends are critically important.
  • Most stock indicators lag too much to effectively predict cryptocurrency price movements.
  • Need to use indicators proven to work for cryptocurrency markets.
  • Do not trade on margin as the higher volatility of cryptocurrency price movements can cause severe loses that liquidate positions.
  • Professional traders combine market knowledge with technical indicators to gain the best trading strategy.
     
     
    https://quantifycrypto.com/ provides real time technical signals and analysis to support your trading decisions. We have the fastest live price feed of all cryptocurrency informational platform. Our proprietary trend algorithm calculates the predicted direction of future price moves. It is specifically tailored for the cryptocurrency market. Our state-of-the-art displays are designed to provide maximum amount of significant data on a single screen.

    None of this is meant to be financial advice and I do not have any financial expertise. Although I worked at the New York Stock Exchange for over 23 years, it was as a developer working on the order flow systems for the NYSE.

    Full discloser: I do own Bitcoin and other Altcoins.