Trading Plan for Cryptocurrency - Part 1
John Barry | Wed Oct 14 2020
I find most things in life are easier when you have a plan. People develop plans for their careers, family events, vacations, weekends, shopping, dieting, exercise and the list goes on endlessly. Sometimes these plans are well defined on paper, sometimes they are just a mental picture of a path you want to follow.
Cryptocurrency trading is hard. I know a trading plan is needed to generate profits while maintaining a necessary level of safety. Since the cryptocurrency market is so unique, I found that the trading plans I have used for other asset classes do not transfer to the crypto space without some necessary modifications.
From my trading experience, these are the key pillars of developing a crypto trading plan.
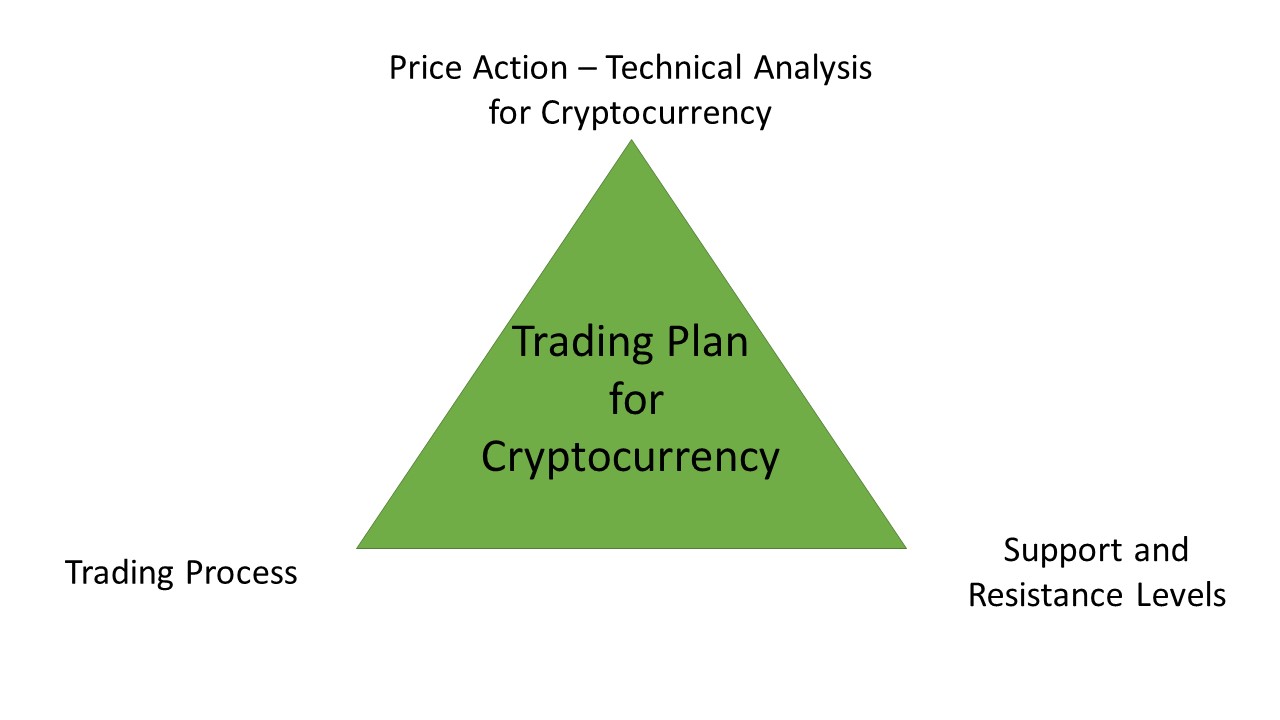
To give a quick overview of each before going into detail
- Price Action - Technical Analysis for Cryptocurrency (Part 1 - Covered here)
- Reduced transparency for most crypto projects changes the metrics used for trading decisions
- Significantly higher volatility and larger price movements
- Increased importance of price patterns and technical analysis
- Support and Resistance Levels (Part 2 - Coming soon)
- Identifying Support and Resistance levels
- Applying Risk and Reward
- Actions when above Resistance, below Support, or in between. How these actions are unique for Crypto
- Trading Process (Part 3 - Coming soon)
- Your trading/investment goals
- Portfolio Management for all our assets
- Your Cryptocurrency Portfolio with diversification
- Risk Management / Locking in profits
Price Action - Technical Analysis for Cryptocurrency
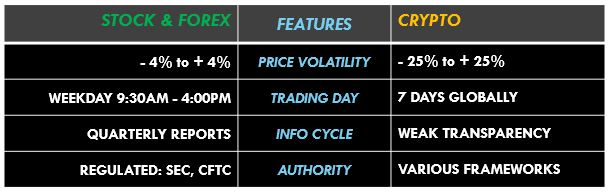
Technical analysis is critically important for cryptocurrency trading. Stock traders enjoy full transparency for the stocks they trade:
- Public companies are required to release detailed financial reports quarterly
- CEO Interview / Company news events
- Government reports, including Federal Reserve policy, providing macro overview of the economy and specific industries
- Proven Technical Analysis methods for stocks, FX and commodities
Most cryptocurrency projects do not have this transparency. This makes the study of price patterns which is at the heart of Technical Analysis critically important. Since the actual price and price movement is the most transparent component for cryptocurrencies.
This leads to the next important questions:
- Can the Technical Analysis tools used for stocks, FX and commodites markets be used for cryptocurrency?
- What are the goals for applying technical analysis to cryptocurrency and how is it different from the goals for stocks?
- Which time periods should be used for cryptocurrency?
- What are the best technical analysis indicators to use for cryptocurrency?
Answer: YES, The Technical Analysis tools used for Stocks, FX and Gold can be used for cryptocurrency!
Understand that the signals they provide have to be interpreted differently for cryptocurrency. This is due to the larger price swings and higher volatility. Simply applying technical analysis proven successful for stocks, FX and other assets should not be blindly applied to cryptocurrency.
An example I can give is the story of Adaptive Capital. They were a 20 million dollar US based cryptocurrency hedge fund that went bankrupt on March 13, 2020 applying proven stock technical analysis and on-chain cryptocurrency analytics to make their cryptocurrency trading decisions. Additionally they were trading on margin, which accelerated their poor trading actions to severe losses. More details about the analytics they used and bankruptcy of Adaptive Capital is in this story link Quantify Crypto
The Relative Strength Index (RSI) is a highly successful tool used for trading traditional assets. The short simple version of the rule is that a RSI value over 70 indicates an overbought position and you should be taking profits, while a RSI value under 30 indicates an oversold position and it is time to buy. Remember the RSI was developed for asset classes that have significantly less volatility and smaller price moves than cryptocurrency. Our research for applying RSI to cryptocurrency shows the complete opposite to be true. The RSI for cryptocurrency is best for indicating potential breakouts, especially for shorter time periods (1 hour and less). Specifically, when a RSI rating of 70 first occurs for Bitcoin and other cryptocurrencies the potential for a large price increase is the most likely outcome.
The goal of cryptocurrency Technical Analysis is to be on the correct side of significant price swings!
The goal of technical analysis for stocks is having a high “win” rate. A goal is to have win rates over 60%. For cryptocurrency, our research shows the most important goal is being on the correct side of significant price swings. This is due to the much higher volatility and larger price swings that occur for cryptocurrency.
Bitcoin has had multiple days with price swings greater than 25% and most cryptocurrencies have higher volatility tha Bitcoin. Applying technical analysis fine tuned for traditional markets that normally have a price range from -1% to +1% on typical trading day, cannot be an apples to apples transition to a market since it frequently has price ranges -10% to +10%
In summary for cryptocurrency trading you want to win big and lose small.
Which time period is best? - Be confident when multiple technical signals and time periods are all in agreement.
In stocks, you often view the daily candlesticks to discover trends. For example the 20, 50 and 200 day moving averages are often quoted. Applying 50 and 200 day moving averages have proven to be a very lagging indicator for cryptocurrency. This link reviews the Bitcoin Death Hoax that occurred on Oct 25th 2019 The Bitcoin Death Hoax of 2019. In summary cryptocurrency has high intraday volatility and price swings, using a daily indicator is going to lag too much to be useful for detecting entry and exit points.
Research we have performed shows that 2 hour candlesticks and shorter durations all the way down to 5 minute candlesticks are all critically important for cryptocurrency price movement. This is due to the larger price swings that occur intraday for cryptocurrency.
For example the 1 hour MACD signal is a popular time period / indicator combination. Instead of just using a single time period, we learned the MACD signal is best when the majority of the 5 minute, 15 minute, 30 minute, 1 hour, 2 hour and 4 hour agree with a price direction. Then you can add to the equation additional indicators like RSI, Bollinger Bands and Trend Algorithm; creates the clearest picture
In summary its a best practice to use multiple candlestick price points and indicators (some primary and some confirming); waiting for the majority to agree with a price direction.
A good momentum indicator is a valuable technical analysis tool for cryptocurrency trading success.
A good momentum algorithm detects smaller cryptocurrency price movements that precede larger price moves. Again, the key goals for crypto: be on the corrected side of significant trades and don’t get REKT. Research on significant price movements (Greater than 10%) for Bitcoin in the past 2 years was preceded by a smaller price movement, or trend change for 10 to 48 hours, prior to this significant move.
A momentum shift occurred on the night (EST) of September 1st 2020. Bitcoin had been trading near $12,100 for multiple hours before starting a slow steady decline. The Quantify Crypto trend algorithm had turned negative along with the MACD, RSI. On September 2nd I wrote a detailed article on all the factors that led me to sell Bitcoin ($11,899), Ethereum ($468), Bitcoin Cash ($290), Ethereum Classic ($6.80), Litecoin ($62.71) and Chainlink ($16.16) - Screenshots, additional details and analytics for this trade are in this article: Technical Analysis for Sept 1st 2020
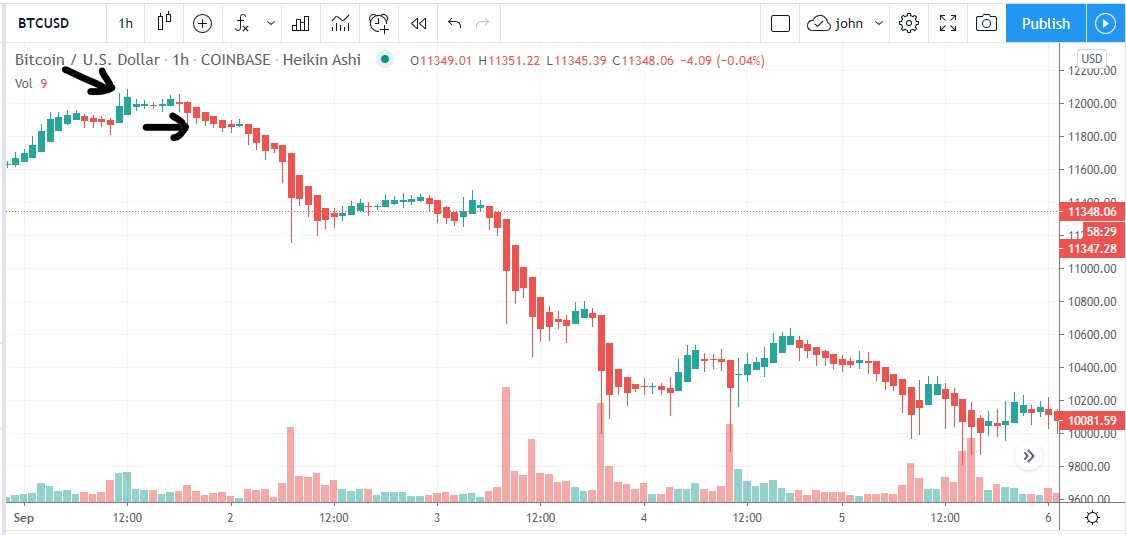
Within 24 hours Bitcoin would drop to $11,158 on its way to lows of $9,815 on Sept 5th. The altcoins would go on to have larger percentage drops. Looking at the chart above, specifically the arrow showing the high price and the arrow showing the sale execution, the price movement now does not seem that severe on the chart. At the time of the sale transaction the price change of $343 was significant.
There is an old trading saying that states “Bulls make money, Bears make money but Pigs get slaughtered”. This means only a Pig tries to buy at the absolute lowest price and sell at the highest price; predicting absolute highs and lows is almost impossible. As a trader I believe in the rule to buy low and sell high. I want proof that a trend has been established in the positive or negative direction before entering or exiting a position. In this case I did not hope for a return to $12,100 to sell at the highest point (like a Pig), but chose to sell as the price was still much higher than my purchase price.
This is a prime example of securing profits and not getting REKTed. While the term “The Trend is your Friend” is very old, it very much applies to the very dynamic cryptocurrency market.
Part 2 of this series will focus on Support and Resistance. While the daily data lags terribly for Cryptocurrency price momentum, I will explain how important this data is for Support and Resistance levels.
The platform Quantify Crypto provides live cryptocurrency prices, technical analysis, news, heatmaps and more. Our flagship product is the trend algorithm, designed to be on the correct side of significant cryptocurrency price moves. We are a new site, please check us out and let us know what you like and do not like about the site. None of this is meant to be financial advice and I do not have any financial expertise. Although I worked at the New York Stock Exchange for over 23 years, it was as a developer supporting computer systems, not as a stock trader. Full discloser: I do own Bitcoin and have stock positions.